68 Trading Plan (02/01 – 08/01/2023) – Will the Market Explode in the New Year?

As we predicted last week, the market has been relatively calm with minimal volatility, allowing everyone to truly "rest." Will BTC show any signs of movement in the first week of the new year? Let’s dive into the details in this article!

68 Trading Plan (02/01 – 08/01/2023) – Will the Market Explode in the New Year?
Review of Last Week’s Trading Results
See also: 68 Trading Plan (26/12/2022 – 01/01/2023) – Time to Rest
Last week, we had a trading plan for BTC and OP, but unfortunately, the price did not follow our plan and remained flat. Thus, this week’s review will be brief, and we’ll move straight into the plan for the upcoming week.
Join the 68 Trading community for more high-quality trading setups!
Analysis and Outlook for Bitcoin (BTC)
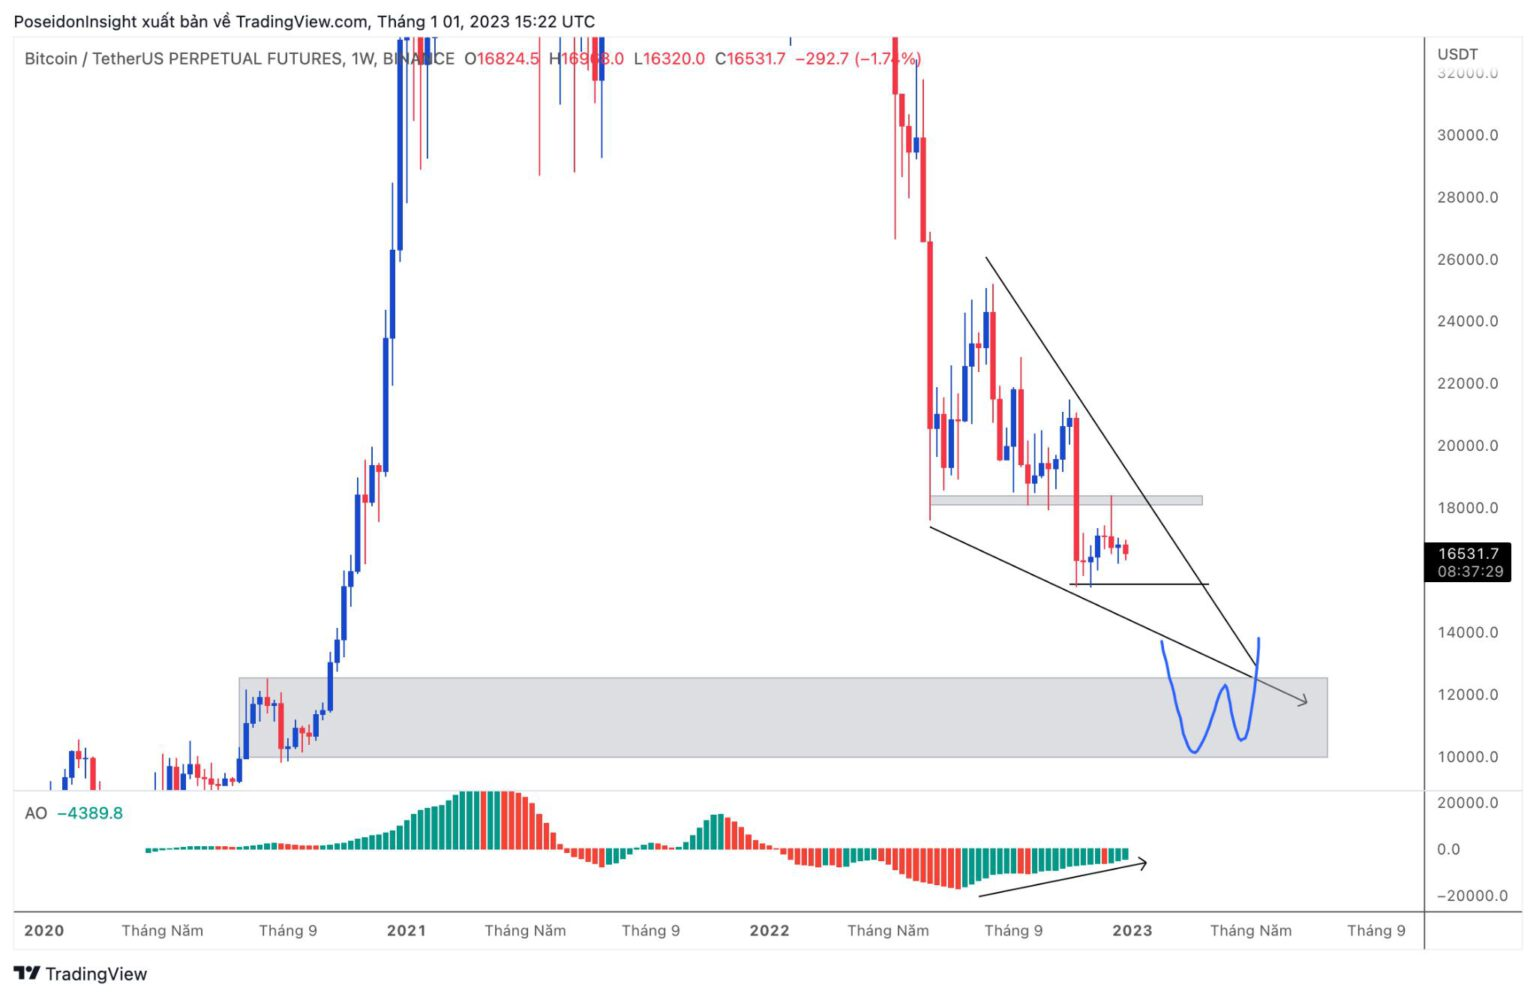
Weekly chart as of January 1, 2023, screenshot from TradingView
The weekly chart continues to show sideways movement within the price range of $15,400 – $18,000. Notice the last three weekly candles: The first candle shows a strong rejection at around $18,000. The next candle broke the closing price of the previous candle but quickly rebounded, forming a doji candle. This week’s candle has a small body, indicating that selling pressure has entered but isn't strong enough to push the price down significantly. This suggests that the price is still moving sideways on both the weekly and daily timeframes.
One key indicator to watch is the beginning of the first stage of a bottom divergence on the weekly chart. While the price has created a lower low, the AO indicator shows a higher low, indicating divergence. This is just the first divergence phase on the weekly chart, and the price might create additional divergence phases. Therefore, my long-term plan remains to wait for buying opportunities in the $10,000 – $12,000 range, which also represents a strong demand zone on the weekly chart.
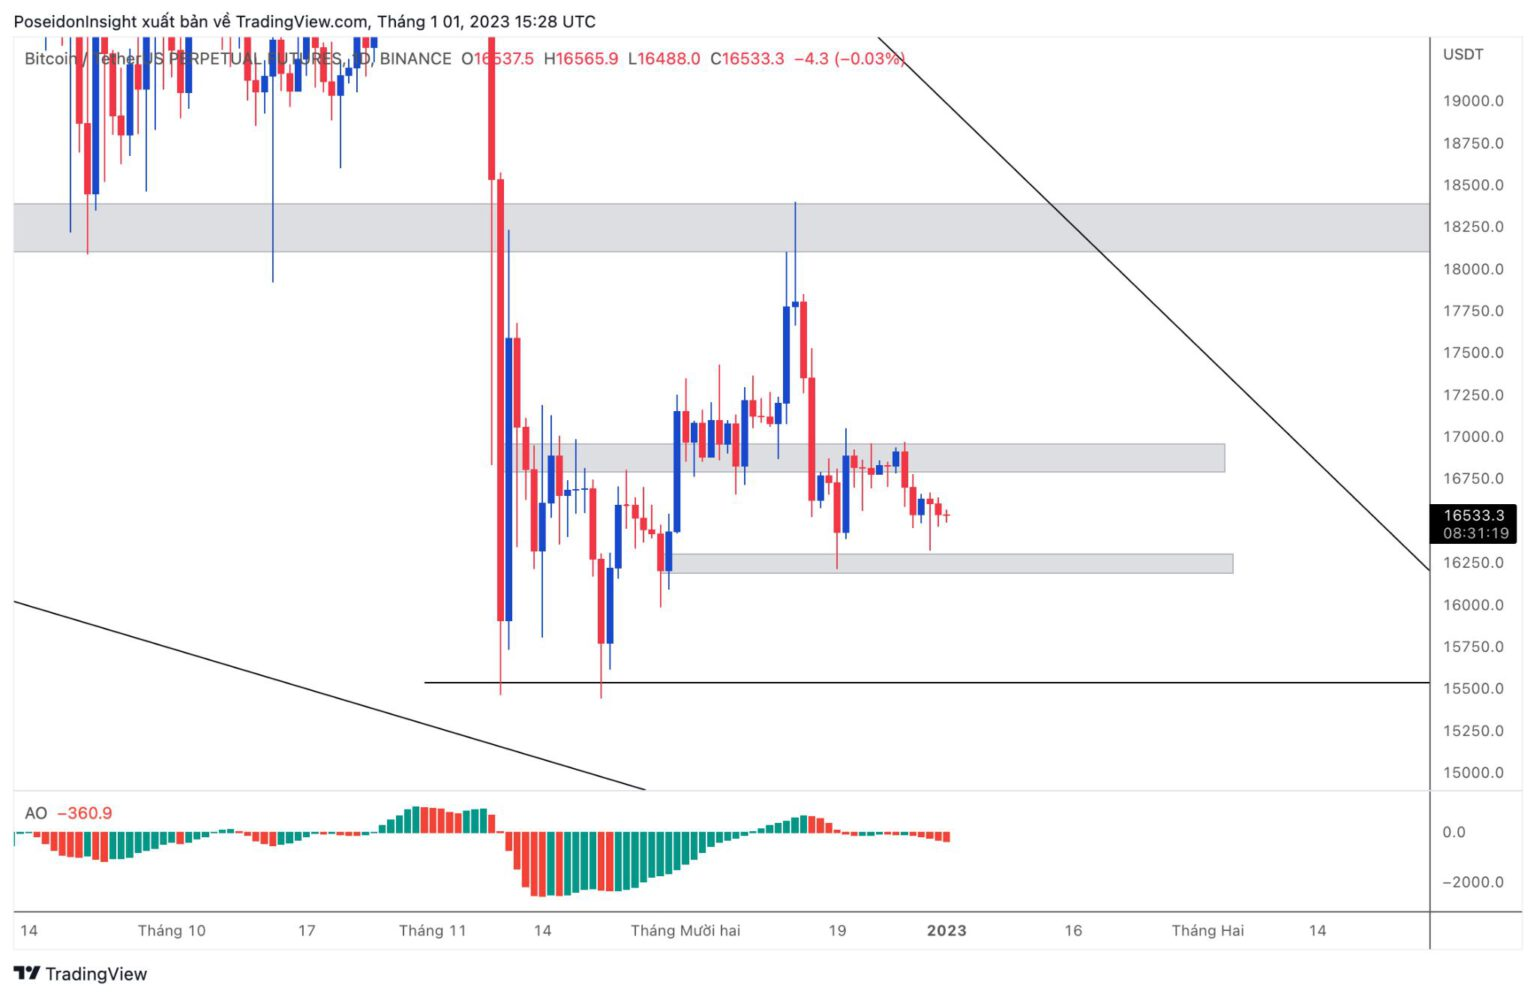
Daily chart as of January 1, 2023, screenshot from TradingView
On the daily chart, the price continues to move within a smaller sideways range of $16,200 – $17,000. If you’re looking to long/short on shorter timeframes (1H/4H), these two price levels are crucial.
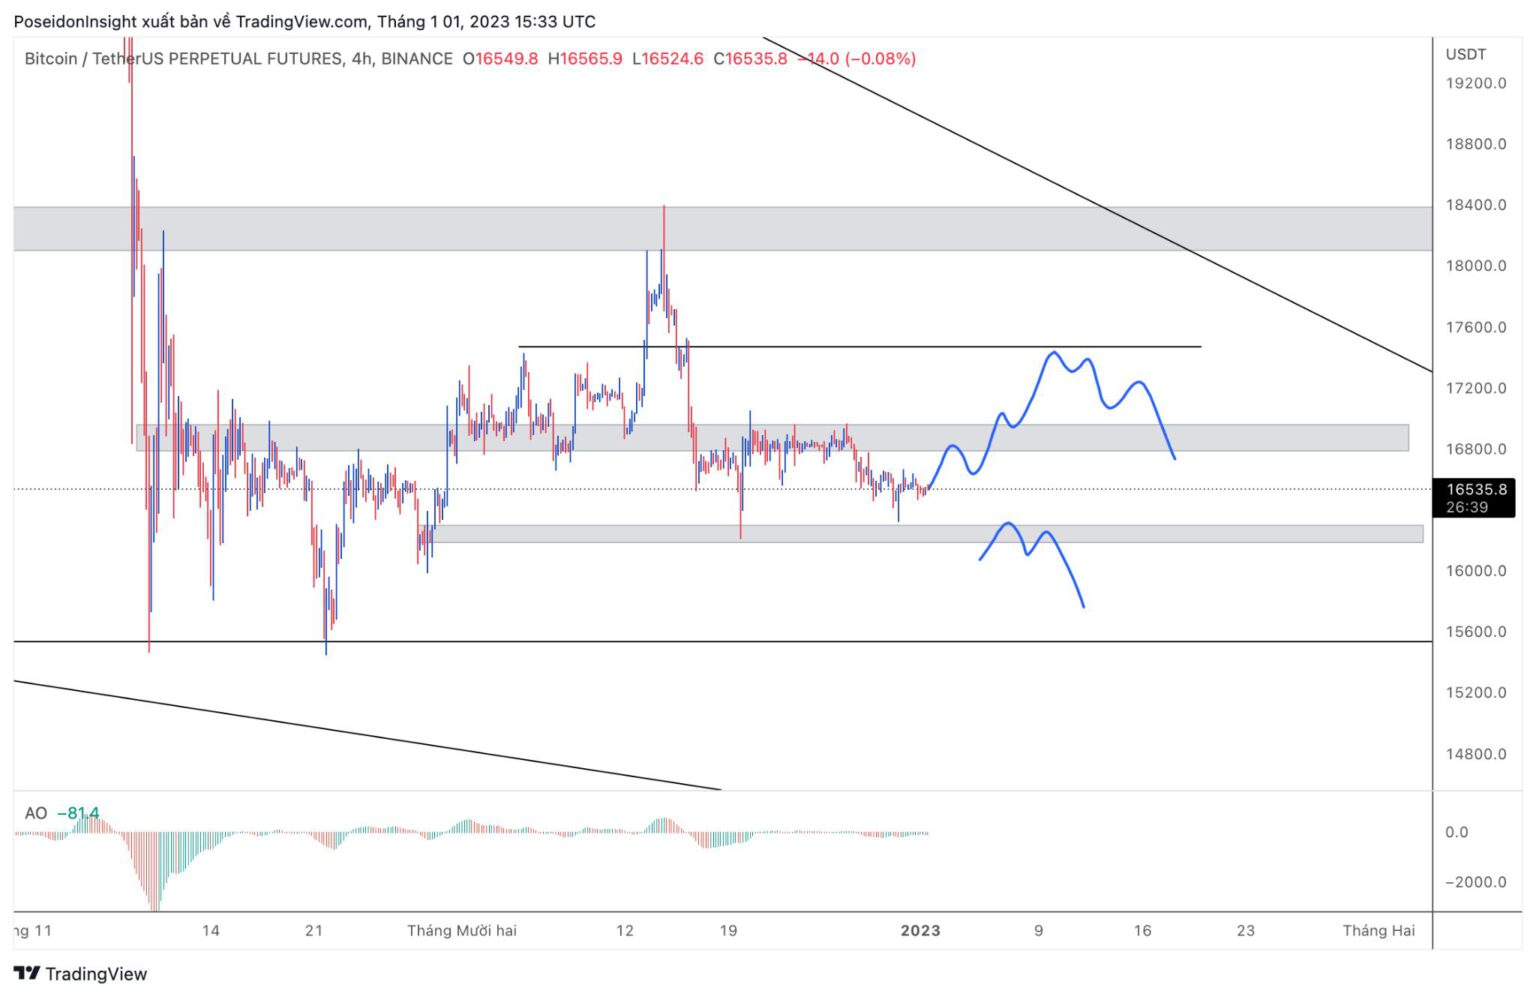
4-hour chart as of January 1, 2023, screenshot from TradingView
On the 4H chart, we can consider shorting in the following scenarios:
- Wait for the price to break above the resistance and then retest the resistance at $17,450 for a short entry.
- Wait for the price to break below the support at $16,200, then retest and short.
Some Plans for Altcoins
DYDX
DYDX is showing strong selling pressure on higher timeframes (M). Therefore, I plan to short this token. The short plan is to wait for a short setup (e.g., double tops, head and shoulders) in the $1.87 – $1.20 range.
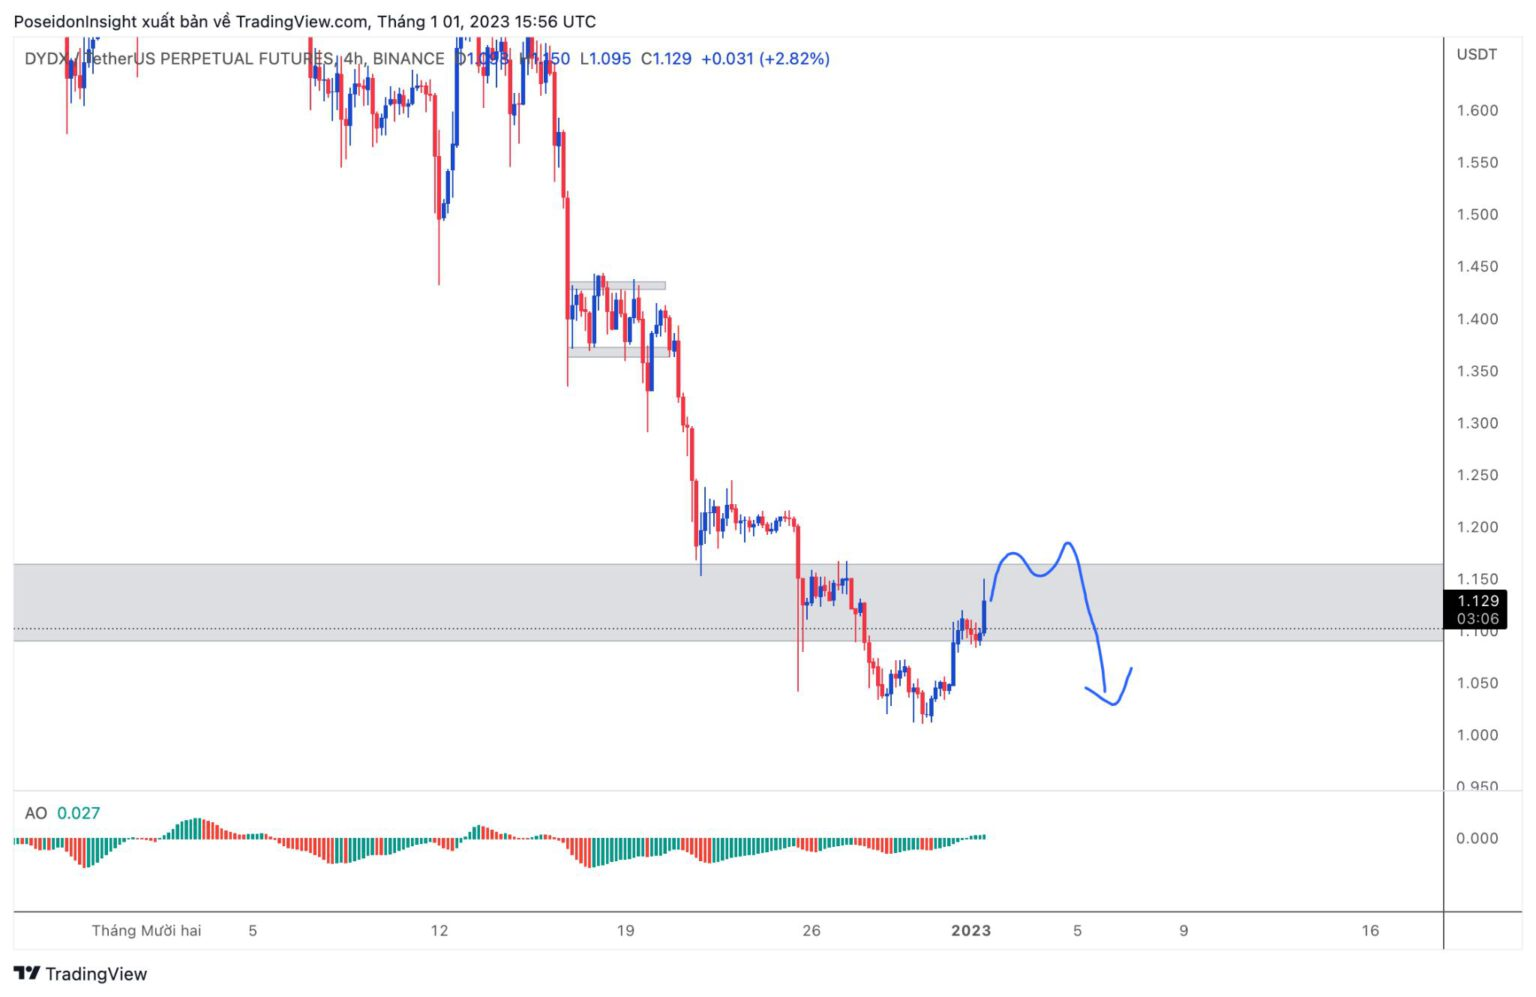
4-hour chart as of January 1, 2023, screenshot from TradingView
APT
Similar to DYDX, APT is experiencing a bounce and is likely to test liquidity at the previously broken support zone ($3.70 – $3.80). You can wait for a short setup in this range.
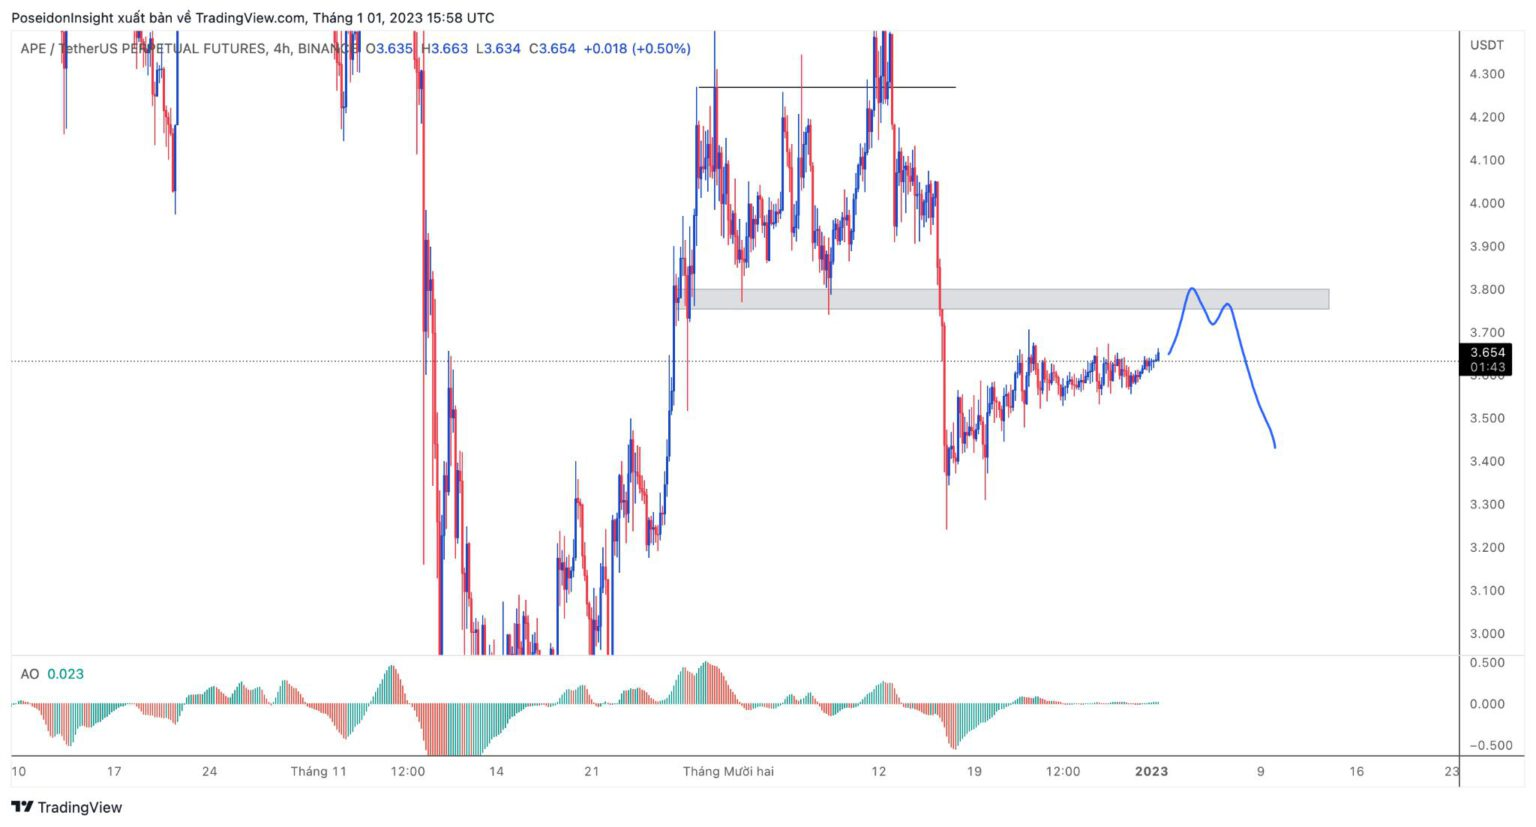
4-hour chart as of January 1, 2023, screenshot from TradingView
Macro News
Global markets will remain on holiday until the end of January 2, 2023, and will resume activity on January 3. Thus, early this week, the market may continue to be dull. This week is relatively quiet with limited news, but you should keep an eye on the following updates related to the US Dollar (USD):
- January 4 (10:00 PM): ISM releases the PMI manufacturing index for December 2021. Actual figures higher than forecasts are considered positive for the USD, while lower figures are seen as negative.
- January 5: At 8:15 PM, the ADP Nonfarm Employment Change index will be released, followed by the Initial Jobless Claims at 8:30 PM.
Conclusion
These are a few personal trading plans from my perspective. I hope you find this analysis helpful for better trading in the coming week. Wishing you a joyful and prosperous New Year!
Don’t forget to join 68 Trading to trade and chat with us!