68 Trading Plan (09/01 – 15/01/2023) – BTC Continues Sideways, Seeking Opportunities in Altcoins
Last week, BTC saw a modest recovery, accompanied by a decrease in BTC.D, which allowed some Altcoins to perform quite well. However, I was bearish and didn't find any suitable setups, resulting in no effective trades. This week, we’ll revisit the market and come up with a better plan.
Review of Last Week’s Trades
Refer to: 68 Trading Plan (02/01 – 08/01/2023) – Will the Market Explode in the New Year?
As mentioned earlier, I had a bearish outlook on APT and DYDX, but neither trade was successful due to price breaking through resistance and failing to form a valid bearish pattern. Thus, there are no setups to analyze this week.
Join the 68 Trading community now for more high-quality trade ideas!
Bitcoin (BTC) Analysis for the Upcoming Week
Weekly Chart Analysis:
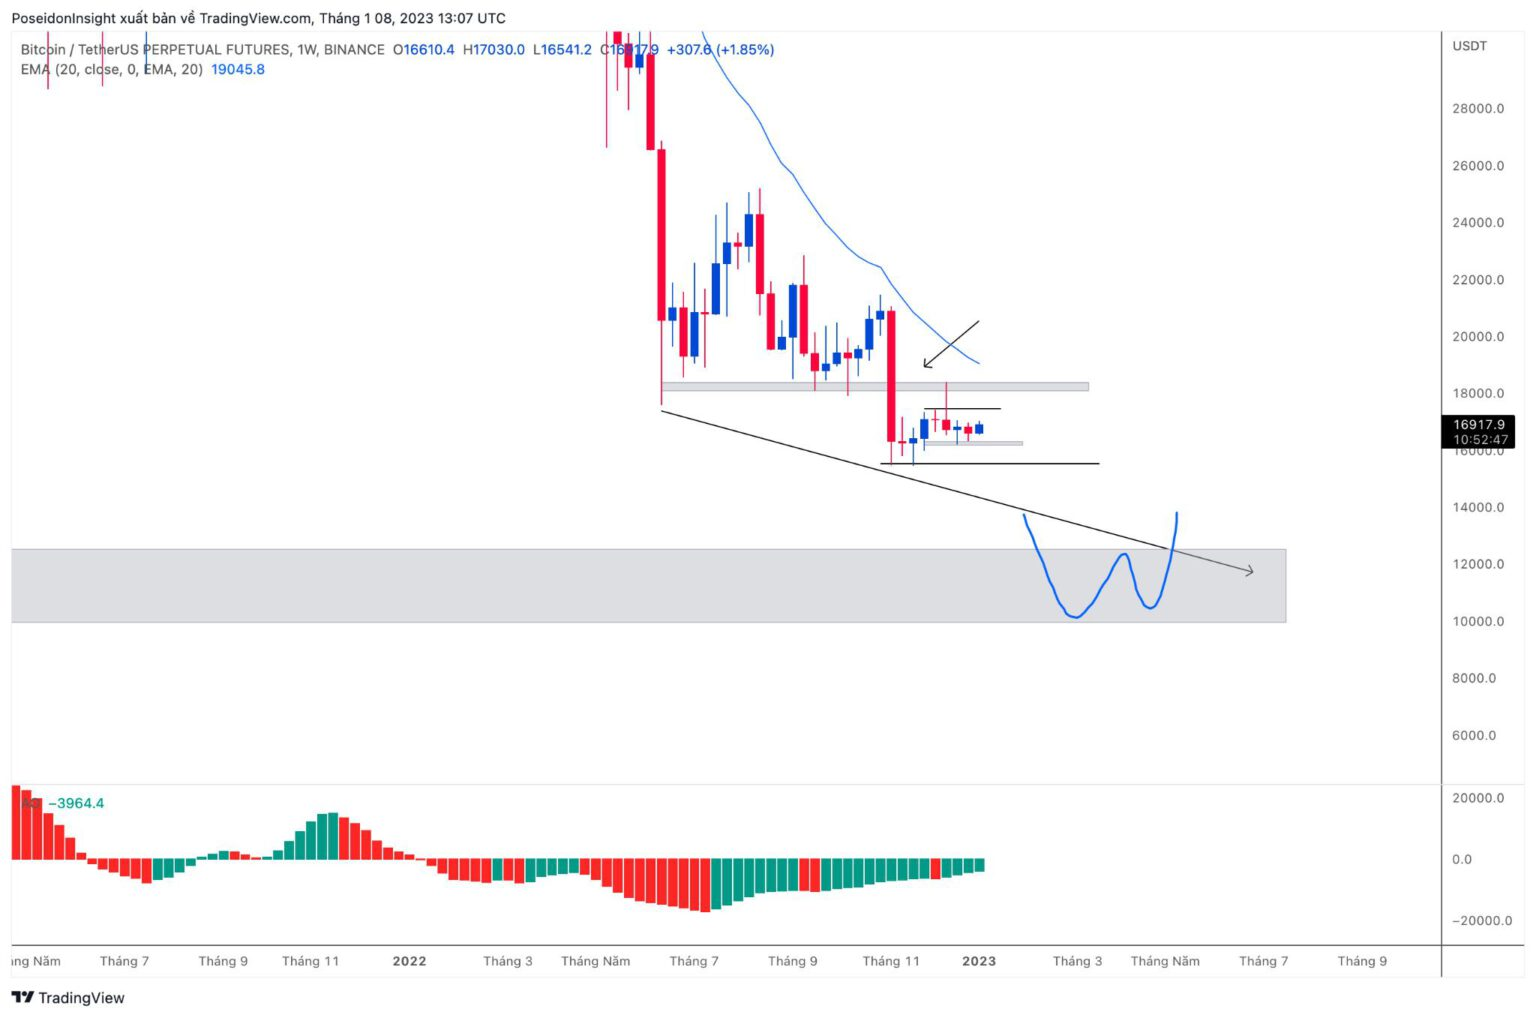
BTC/USDT 1W Chart on Binance Futures, Screenshot from TradingView as of the evening of 08/01/2023
The weekly chart shows BTC still ranging sideways between $15,400 and $18,000. If this week’s candle closes around $16,900, it will indicate some buying pressure, but the candle body is still very small and lacks a breakthrough compared to previous candles.
One key point to note is that the weekly chart is beginning to show the first sign of a bearish divergence. Although the price has formed a lower low, the AO indicator has formed a higher low, indicating divergence. This is just the first divergence signal on the weekly chart, and further divergences could develop. Therefore, my long-term plan remains to wait for a buy opportunity in the $10,000 – $12,000 range, which also aligns with a strong support zone on the weekly chart.
Daily Chart Analysis:
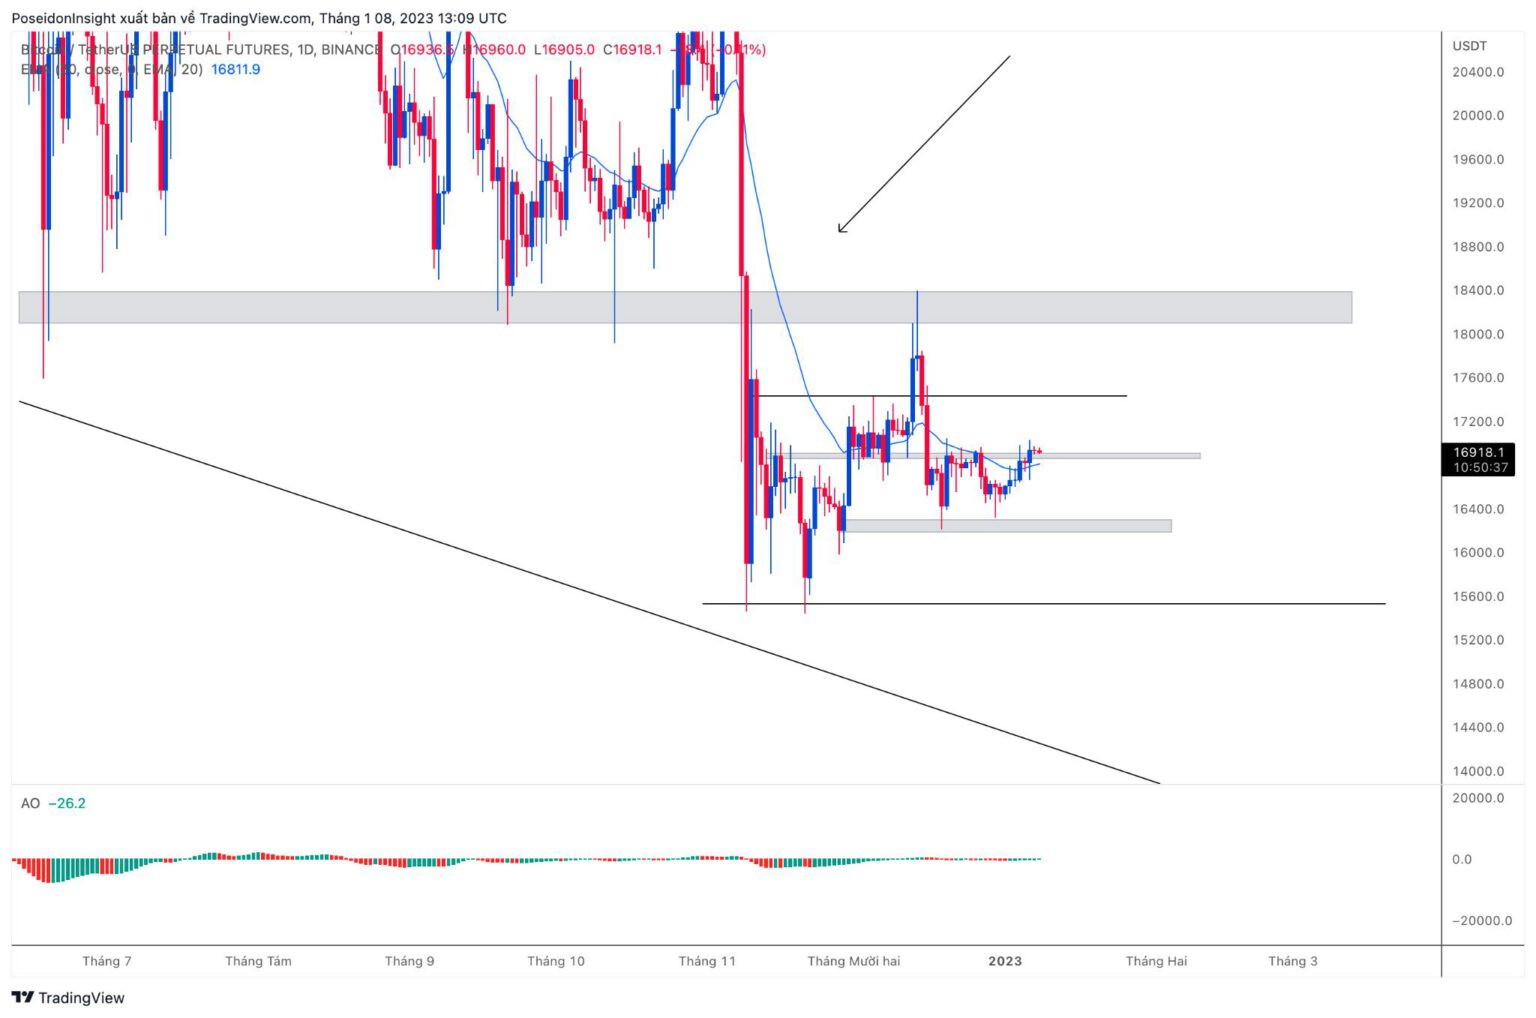
BTC/USDT 1D Chart on Binance Futures, Screenshot from TradingView as of the evening of 08/01/2023
The daily chart continues to show a smaller sideways range, from $16,200 to $17,200. Currently, the price is in the middle of this range, and there are no clear signals for entering a trade based on the candlestick patterns.
4-Hour Chart Analysis:
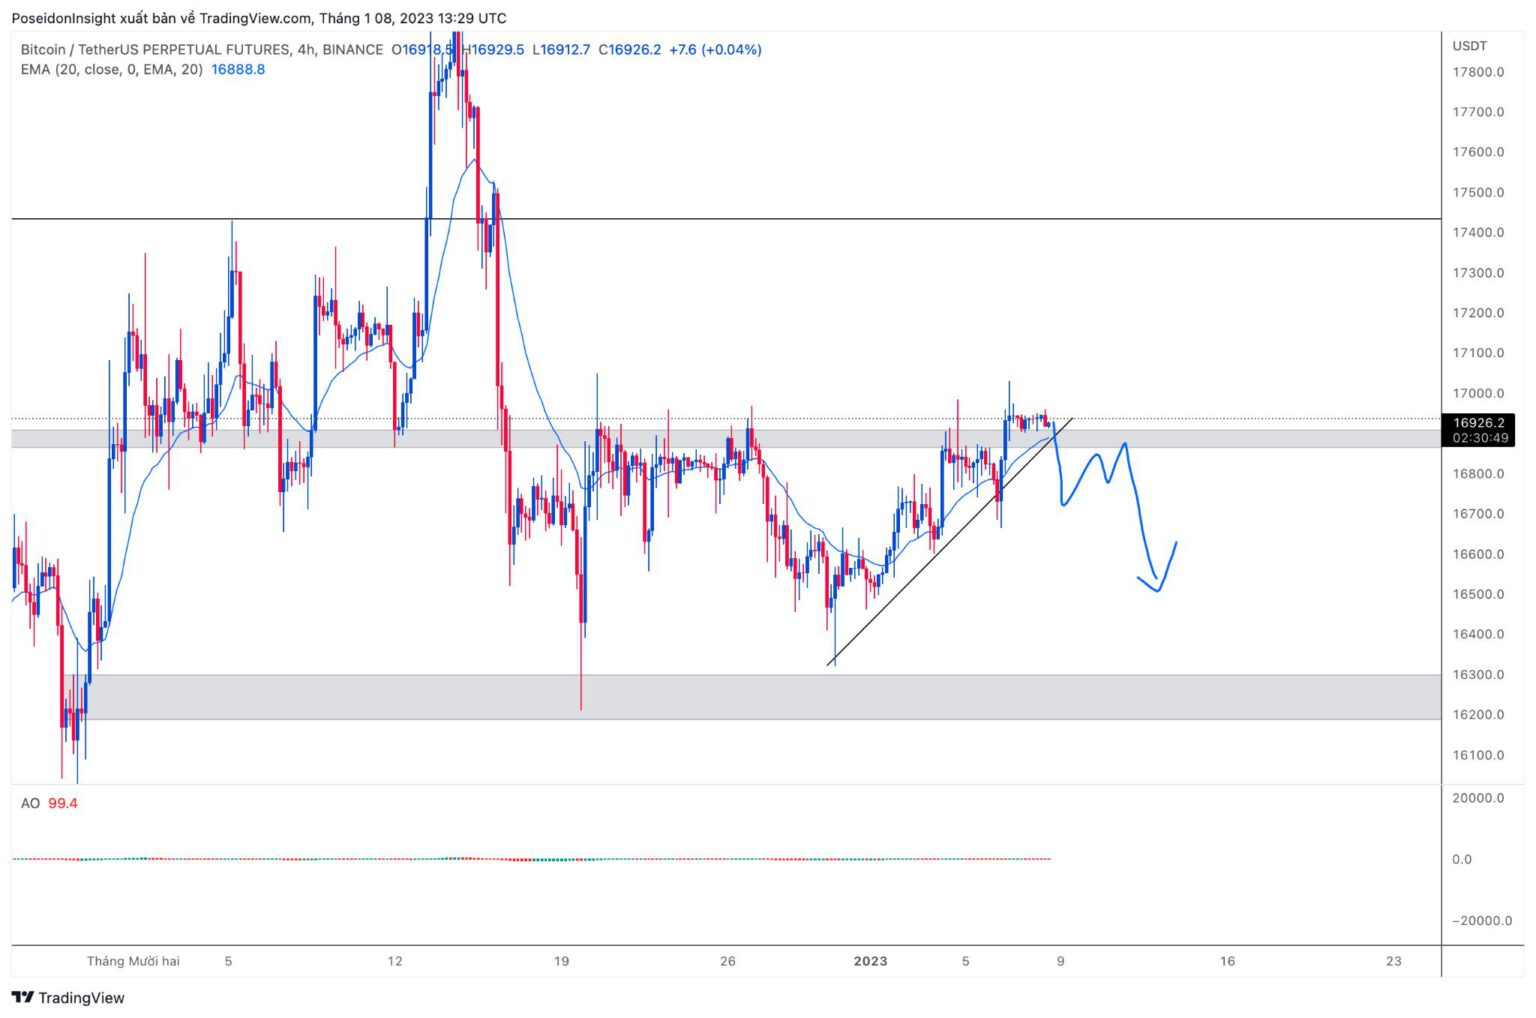
BTC/USDT 4H Chart on Binance Futures, Screenshot from TradingView as of the evening of 08/01/2023
Deciding on a trade is challenging in the current market conditions. The 4-hour BTC chart appears to be forming an uptrend and has broken through resistance at $16,800, respecting this price level. However, the latest candlestick formations are quite frustrating (sideways). Therefore, I will avoid taking a long position and will wait for a short setup if the price breaks the trendline and forms a double-top pattern.
Altcoin Trading Plans
DOT:
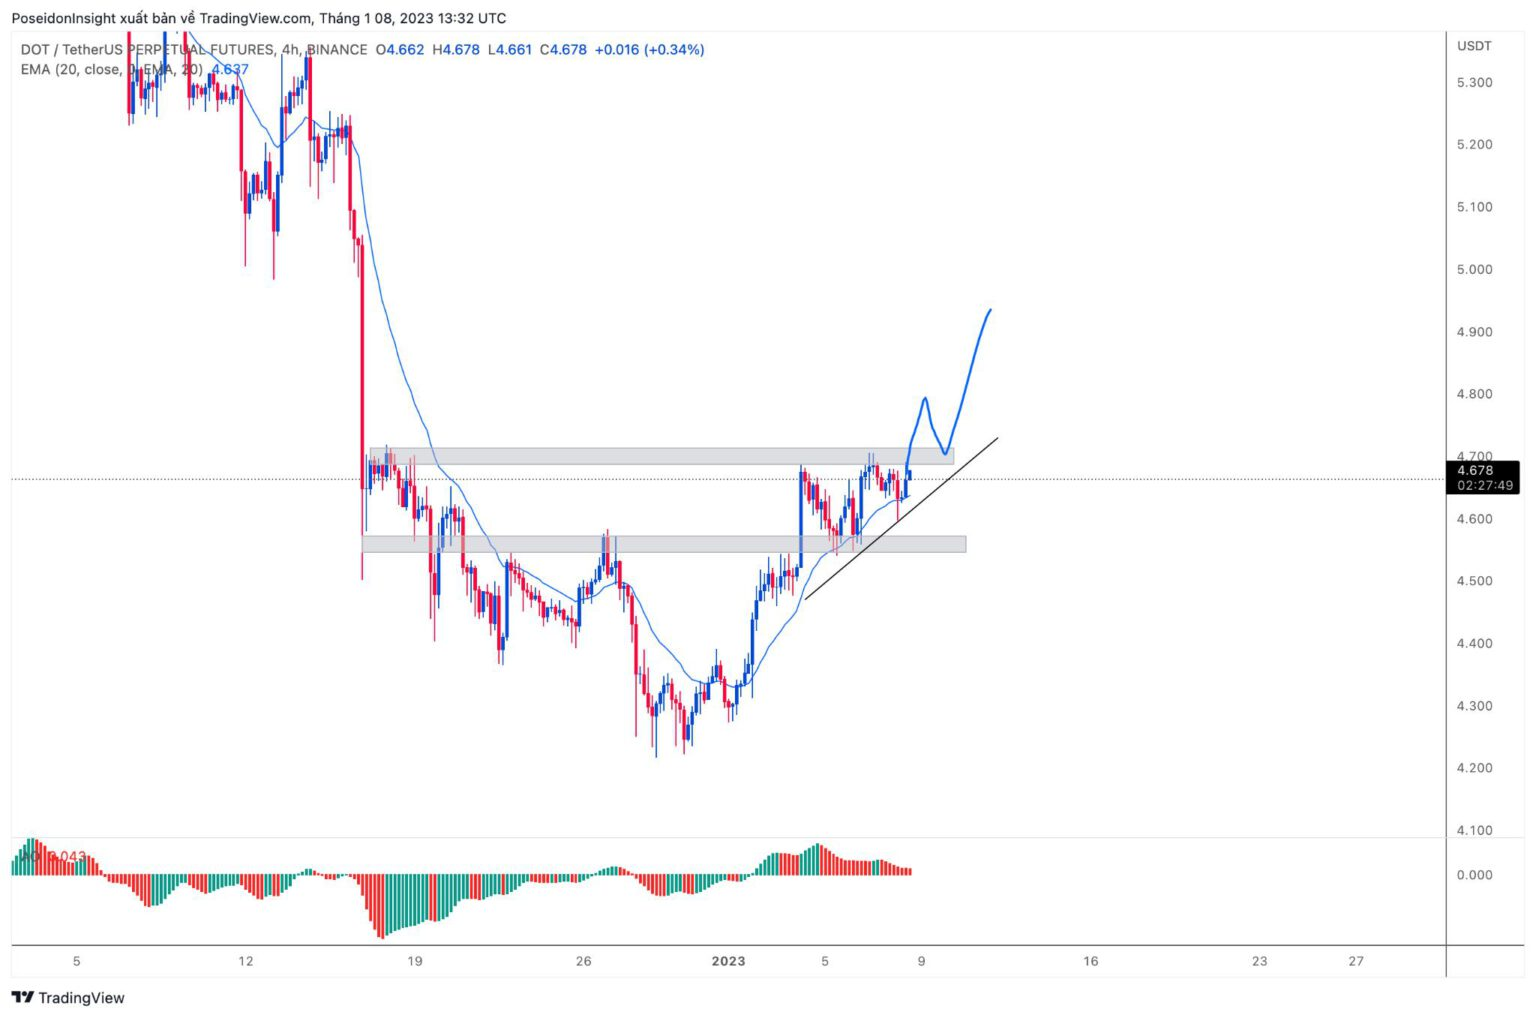
DOT on the 4-hour chart is forming a bullish flag pattern. You can set up a long trade if the price breaks through resistance at $4.70 (ensure strong buying pressure), and then monitor for a potential entry.
OP:
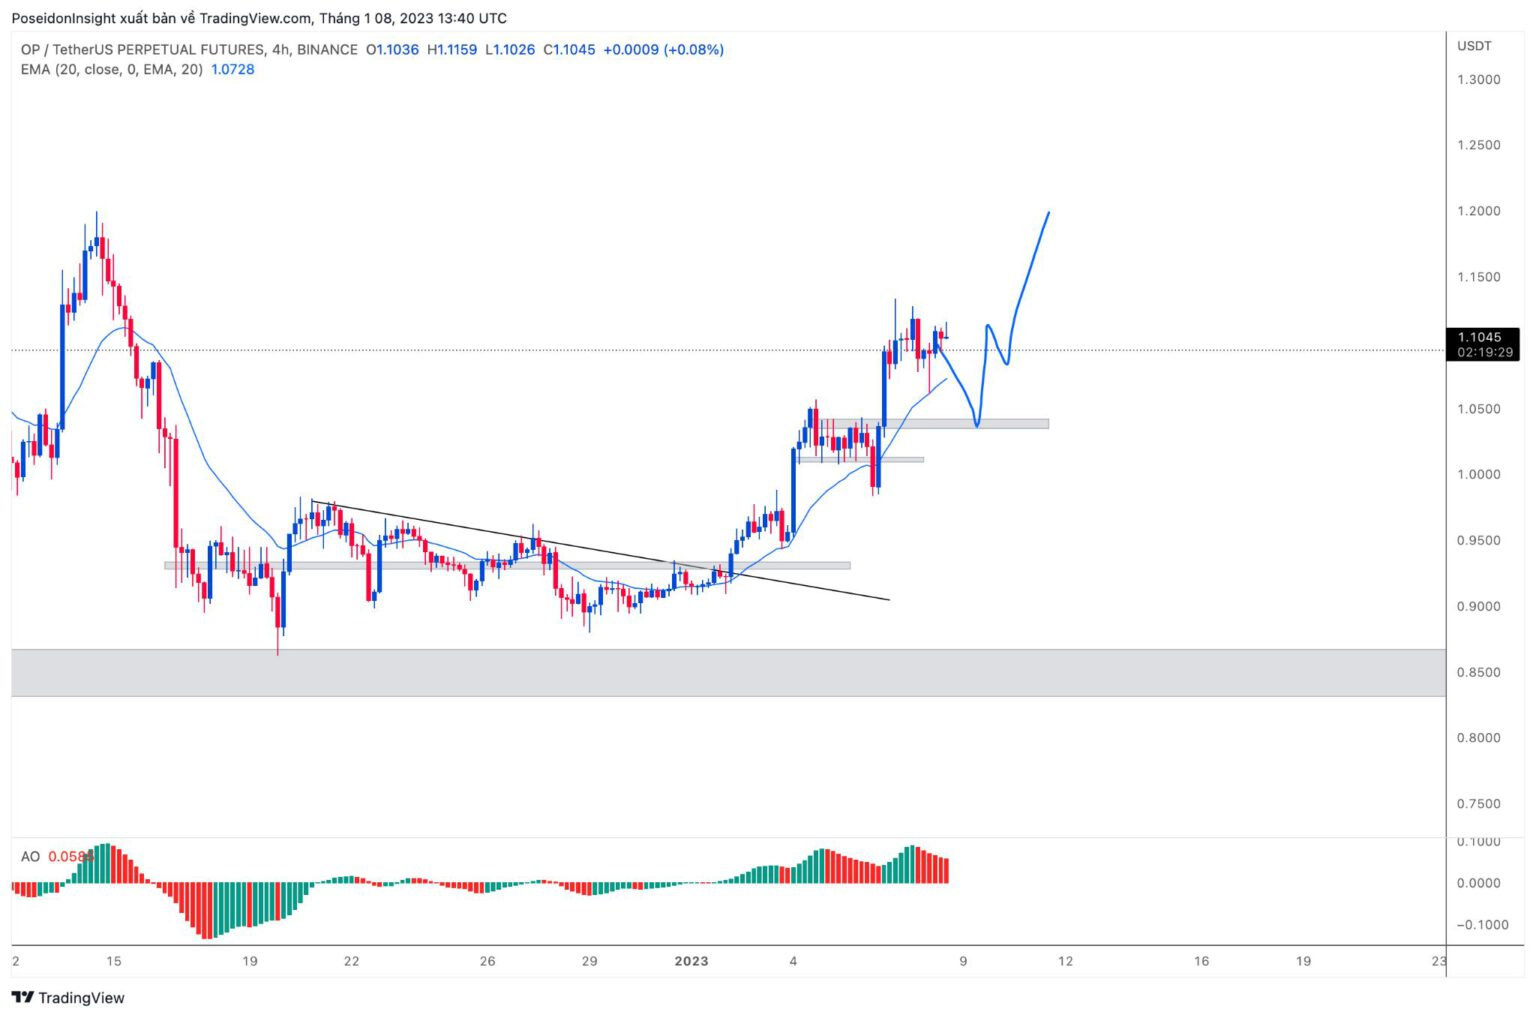
OP has shown a strong uptrend on the 4-hour chart. Consider waiting for a pullback to the $1.03 support level, then enter a trade on the 15-minute or 1-hour chart with a solid candlestick setup.
Macro News
Next week could bring significant market movements with several important news events:
- January 11 (00:00 UTC): EIA releases the Short-Term Energy Outlook, impacting oil prices and inflation. Additionally, the U.S. will announce crude oil inventory data at 20:30 UTC.
- January 12 (20:30 UTC): The U.S. will release Consumer Price Index (CPI) data and initial jobless claims figures, both crucial for assessing inflation and economic health.
Conclusion
These are a few trading plans from my perspective. I hope they provide you with valuable insights for better trading this week. Wishing you a new year full of joy and success!
Don’t forget to join 68 Trading for more trading opportunities and discussions!