68 Trading Plan (10/24 – 10/30/2022) – Anticipating Major Market Moves

This week, we saw Aptos (APT) launch its token, sparking a significant FOMO wave. However, the overall market sentiment remains relatively subdued. In this article, we'll analyze the market and discuss potential moves.

Bitcoin (BTC) Analysis
On the weekly (W) chart, Bitcoin continues to consolidate between $18,500 and $19,500—an area of strong support, as noted in last week's plan. This week’s key point is that if nothing significant happens and the weekly candle closes with a similar pattern to the current one, we may see an Inside Bar formation.
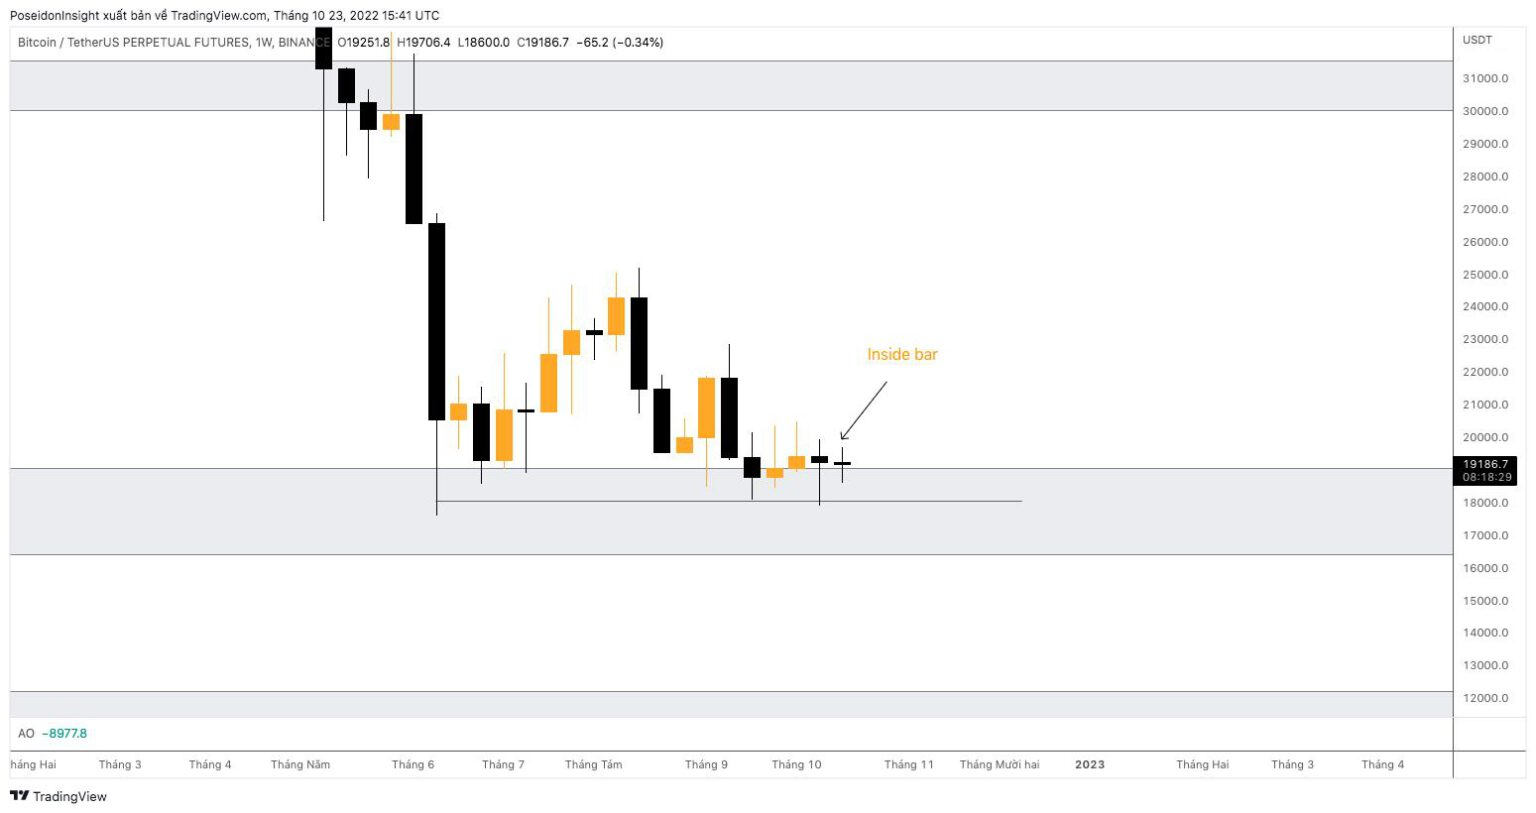
Weekly Chart of BTC/USDT on Binance Futures, Screenshot from TradingView on 10/23/2022
An Inside Bar pattern indicates strong price compression. The two candles forming this pattern have small bodies with long wicks, reinforcing this view. Following an Inside Bar pattern, significant volatility is often observed, so Bitcoin could experience substantial price movements next week.
We'll also examine price action in shorter time frames:
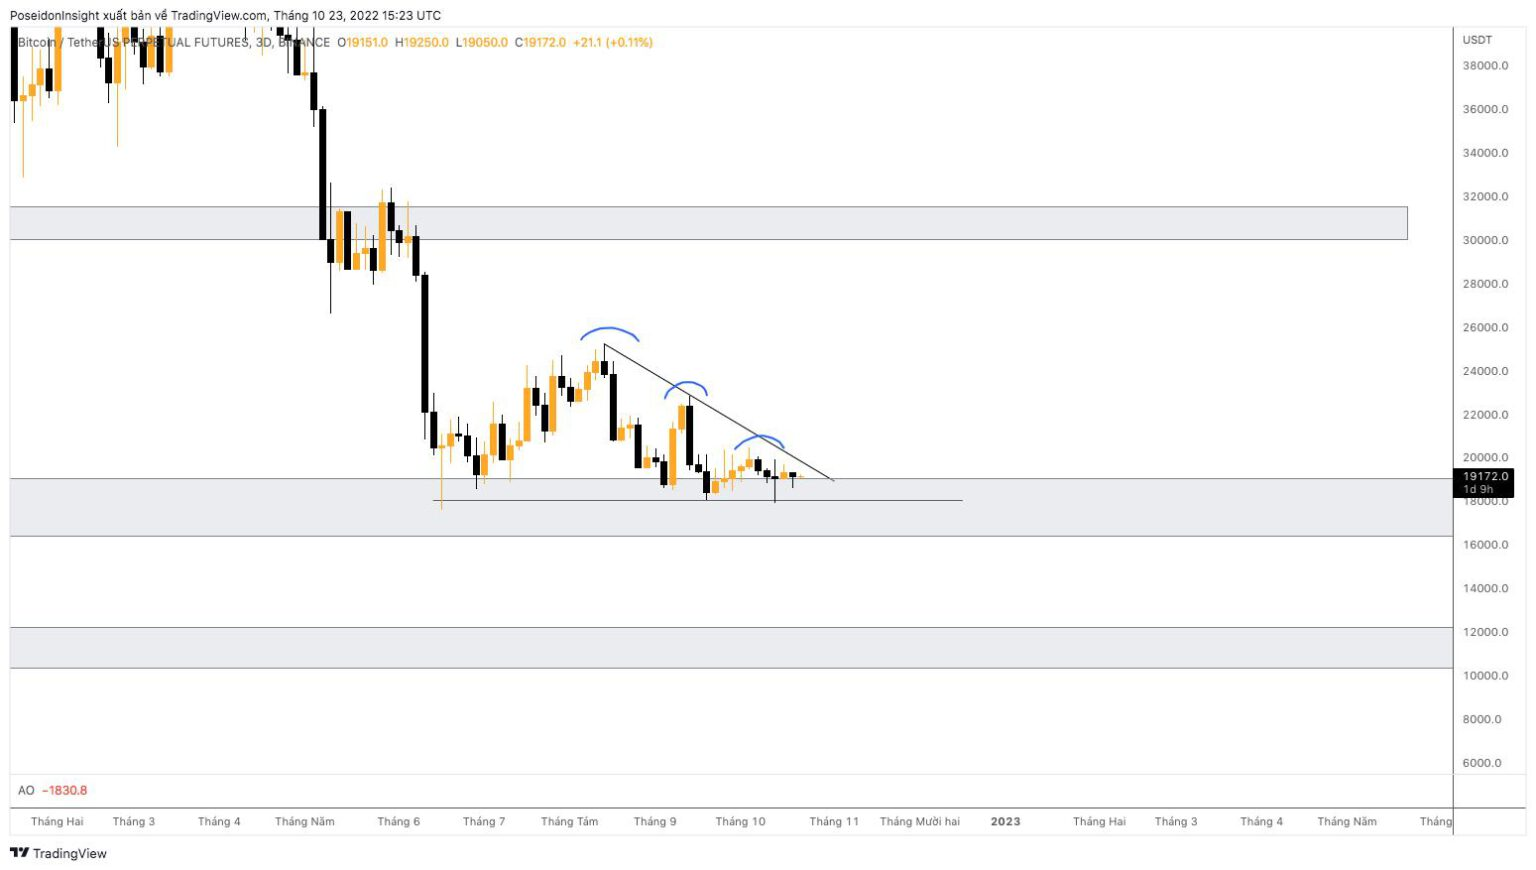
3-Day (3D) Chart of BTC/USDT on Binance Futures, Screenshot from TradingView on 10/23/2022
In the 3D chart, Bitcoin is currently blocked by a downward trendline. After three consecutive tests, the price continues to respect this trendline. A break of this trendline or a rejection will be critical signals for determining the market direction in the near term.
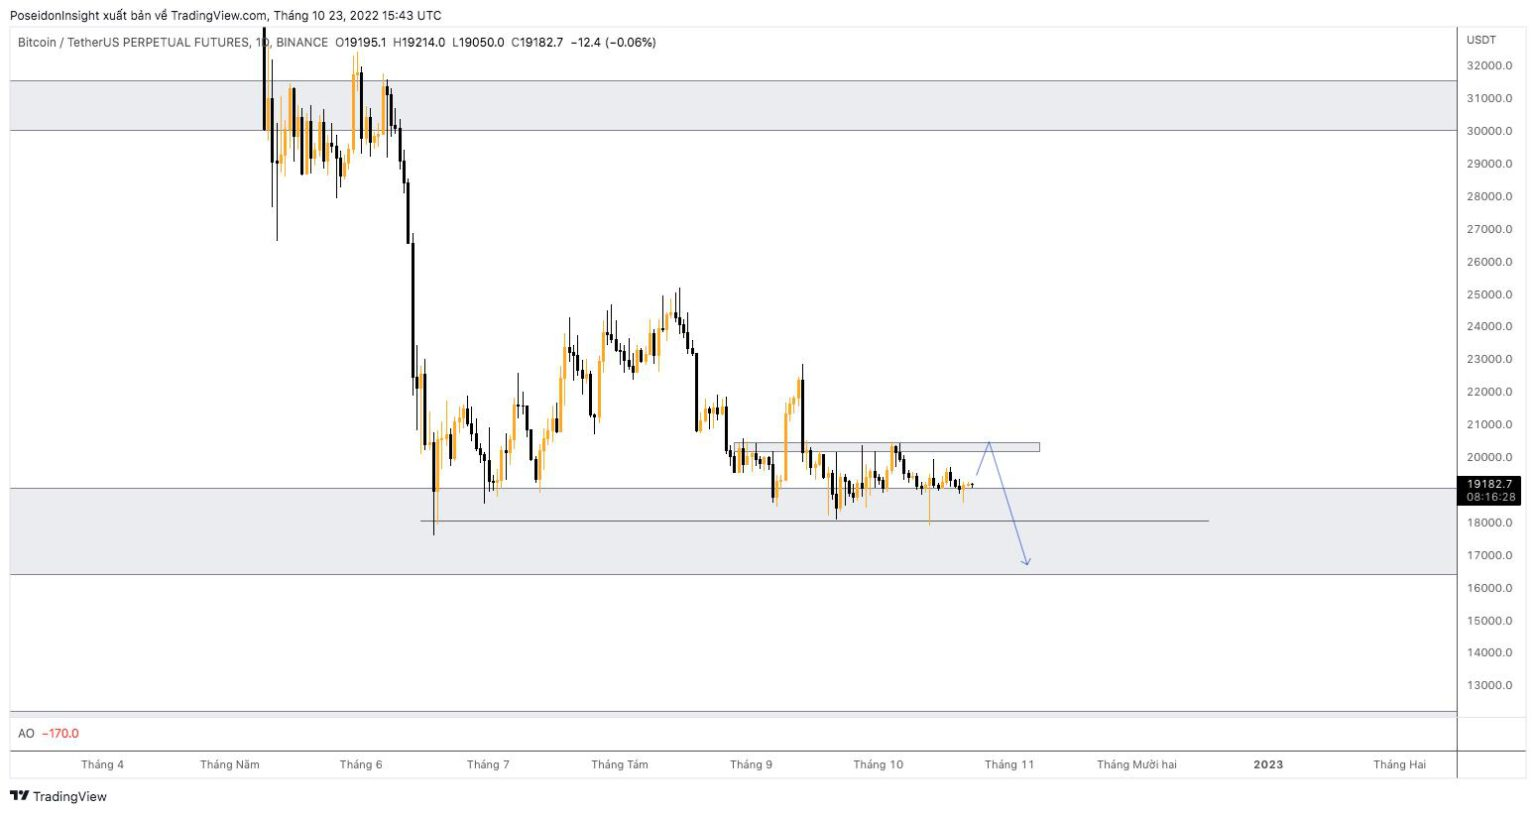
Daily (D) Chart of BTC/USDT on Binance Futures, Screenshot from TradingView on 10/23/2022
On the daily chart, the price is moving sideways, but there are signs that the bears are gaining control:
- Bullish candles (orange) have upper wicks.
- Bearish candles (black) close with full bodies and minimal lower wicks.
Thus, my plan for this week is to wait for the price to reach the $20,200 – $20,400 range and then consider shorting, as this range also represents recent resistance.
BTC Dominance (BTC.D)
Last week, we anticipated a "shake-out" of BTC.D, but this did not materialize. Currently, BTC.D remains relatively stable with no major developments to report.
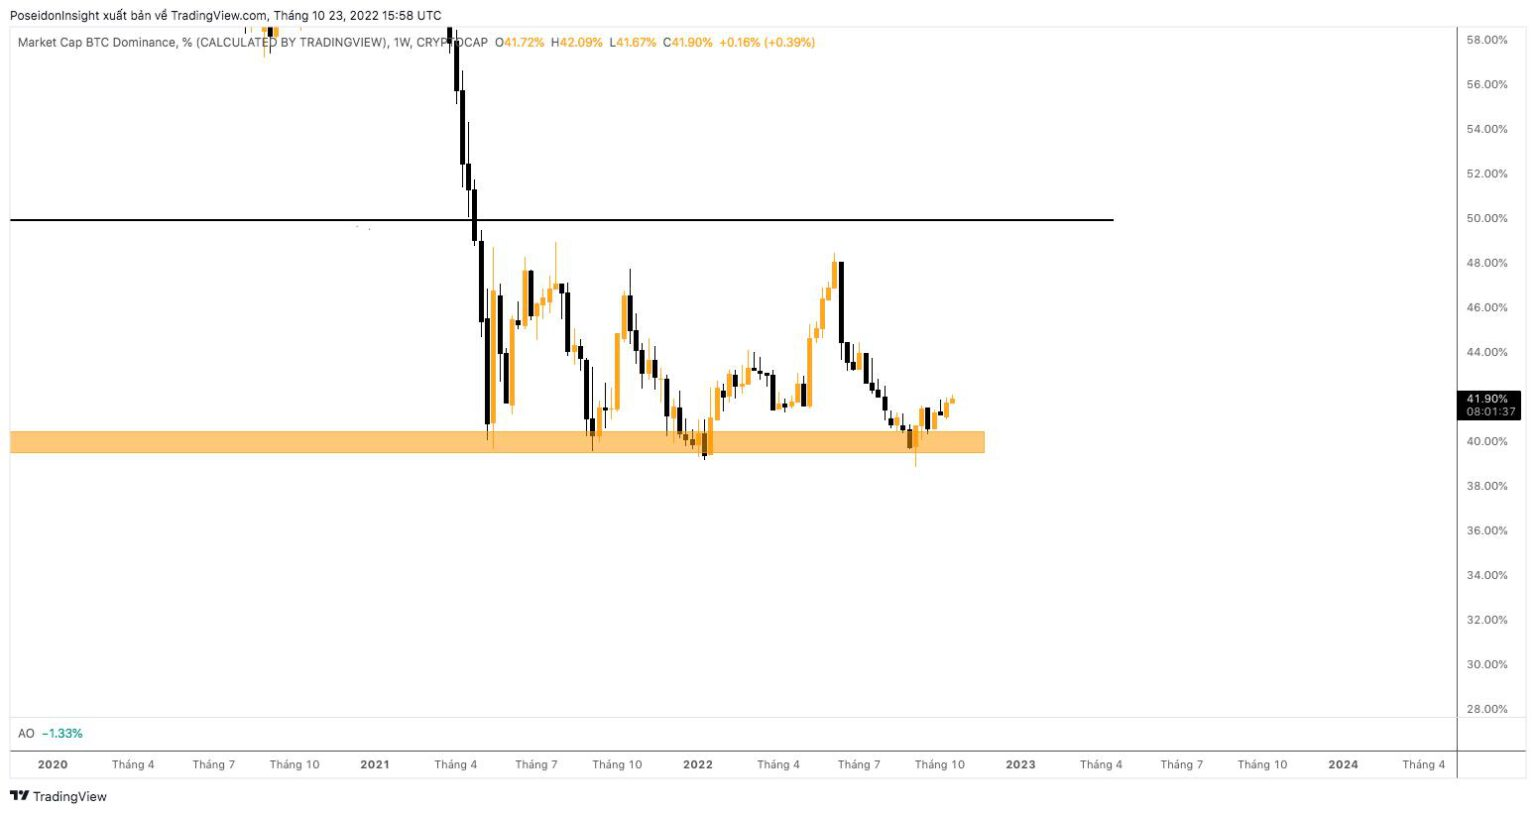
BTC Dominance Chart, Screenshot from TradingView on 10/23/2022
Promising Altcoins
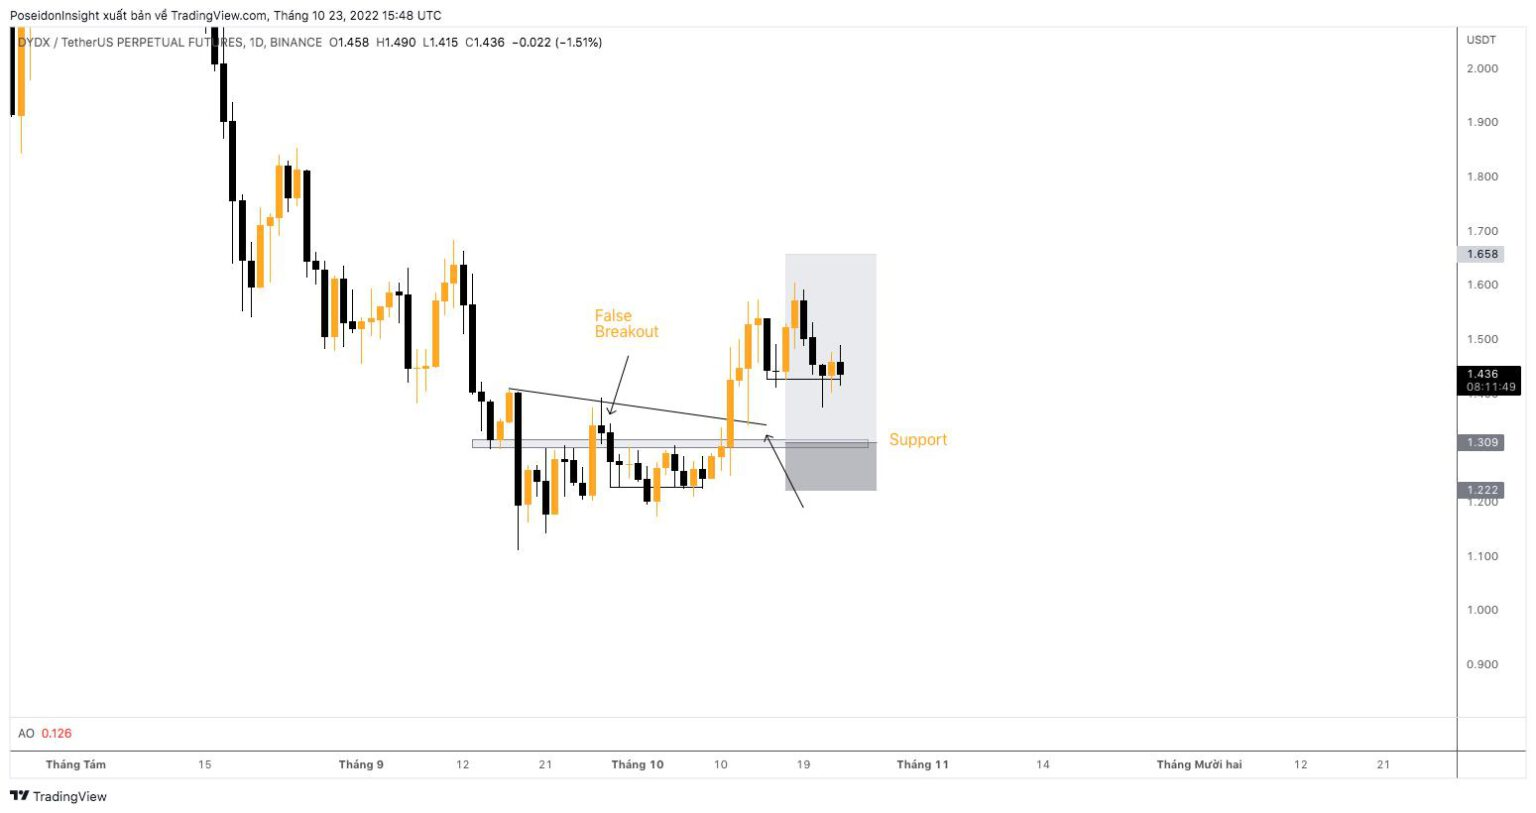
DYDX
Last week, we had a buy plan for DYDX. While the trend was correct, the pullback did not trigger our buy order.
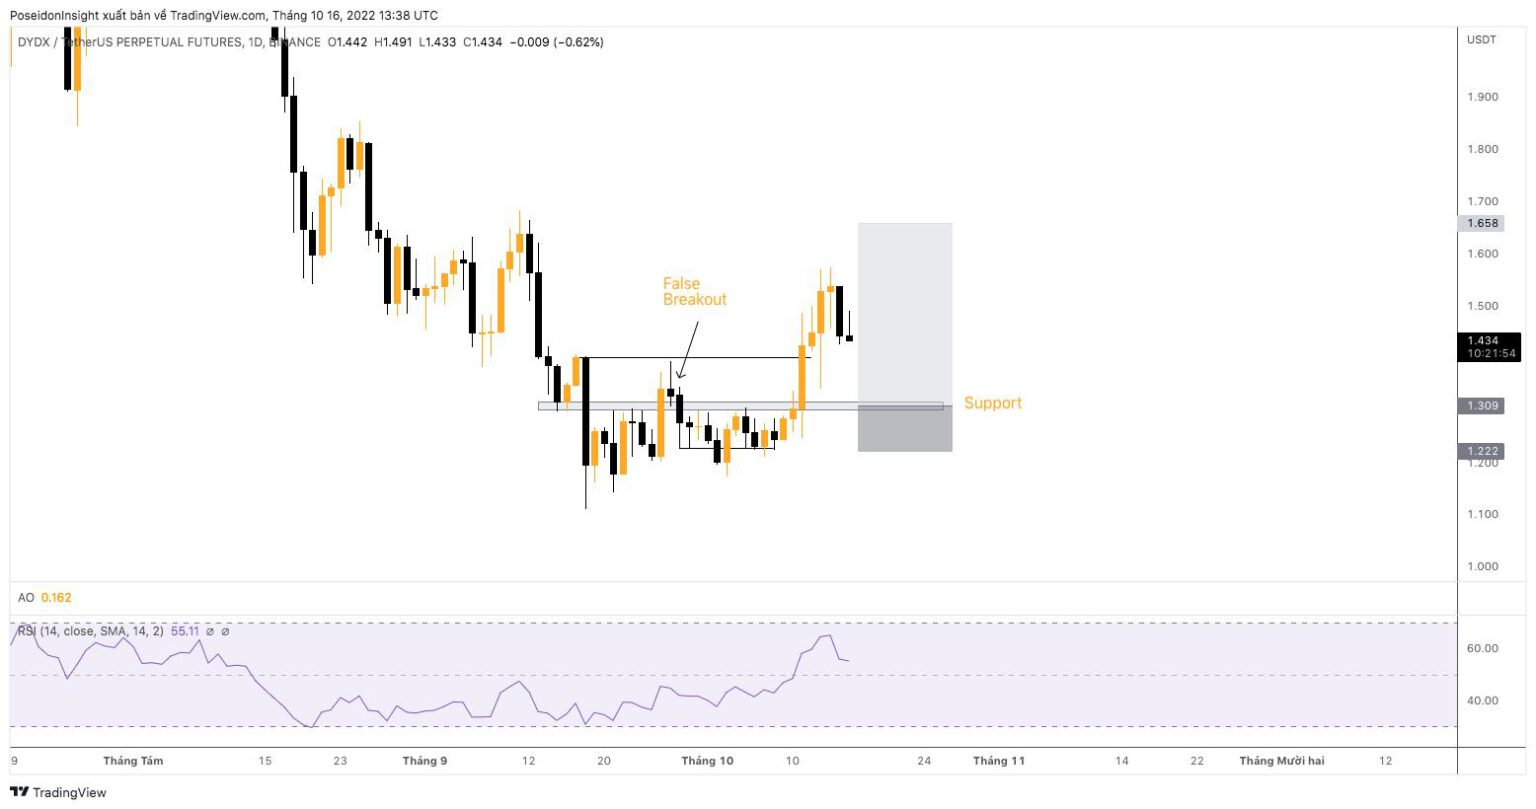
Daily Chart of DYDX/USDT on Binance Futures, Screenshot from TradingView on 10/23/2022
This week, the plan is to watch for DYDX to return to the desired buying range and consider long scalping in shorter time frames (4H or 1H).
APT
APT has recently broken out of a sideways pattern on the 1H chart and experienced a strong upward move. The plan now is to wait for a pullback in APT and then go long according to the trend.
The price has broken out of the ascending channel, so patience is key. A good buying range is $8.3 – $8.6 (aligning with Fibo 0.5).
Daily Chart of APT/USDT on Binance Futures, Screenshot from TradingView on 10/23/2022
Important News
On October 26 and 27, we will see some significant economic data:
- On October 26, the U.S. will release crude oil inventory data, which can impact fuel prices and potentially affect inflation.
- On October 27, the U.S. will report GDP figures for Q3 2022, reflecting the economic health and providing a basis for the Fed's interest rate adjustments.

These updates will help gauge the Fed's interest rate decision set to be announced on November 3.
Conclusion
These are some trading plans from my personal perspective. I hope they provide a useful viewpoint for your trading decisions next week. Don't forget to join the 68 Trading group on Telegram to trade and chat with us!