68 Trading Plan (11/14 – 11/20/2022) – A Fiery Week Ahead


Review of Last Week's Trades
Hey everyone, last week was filled with continuous drama surrounding the FTX exchange and we saw some very negative market reactions. Because of this, I decided to sit on the sidelines and observe rather than trade. It's a pity we had the right prediction and planned a short position for Bitcoin, but couldn't get the entry.
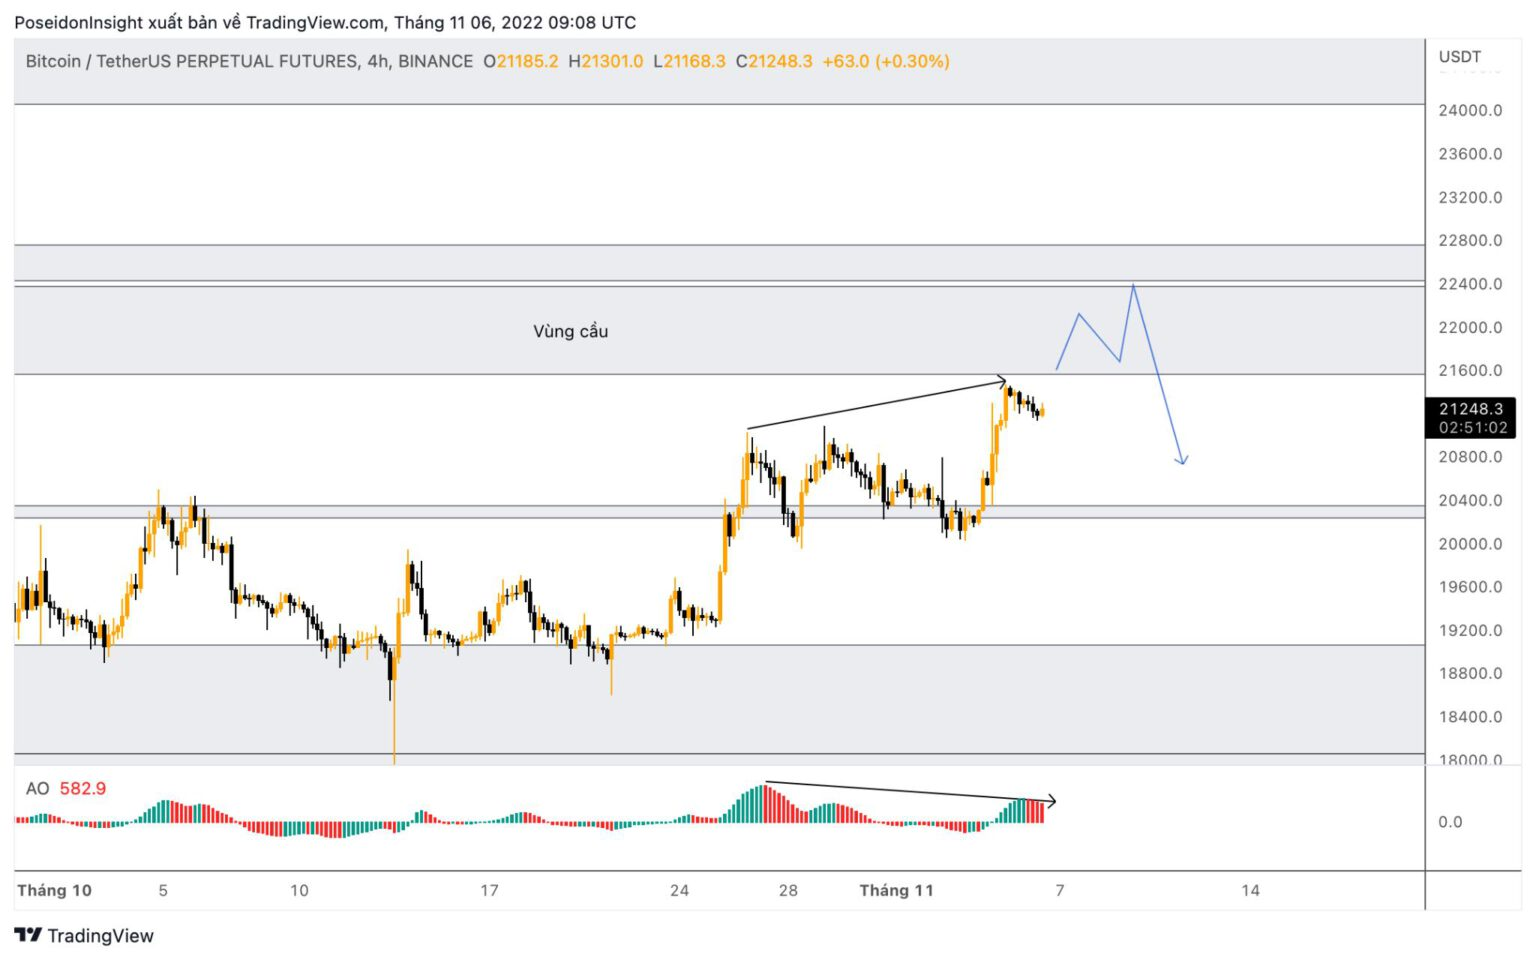
4H Chart of BTC/USDT on Binance Futures, screenshot from TradingView as of 11/13/2022
However, we did manage to secure a trade with LINKUSDT. The plan was to buy in the $8-$8.2 range. With the price dump, we got our entry and it quickly reached our take-profit.
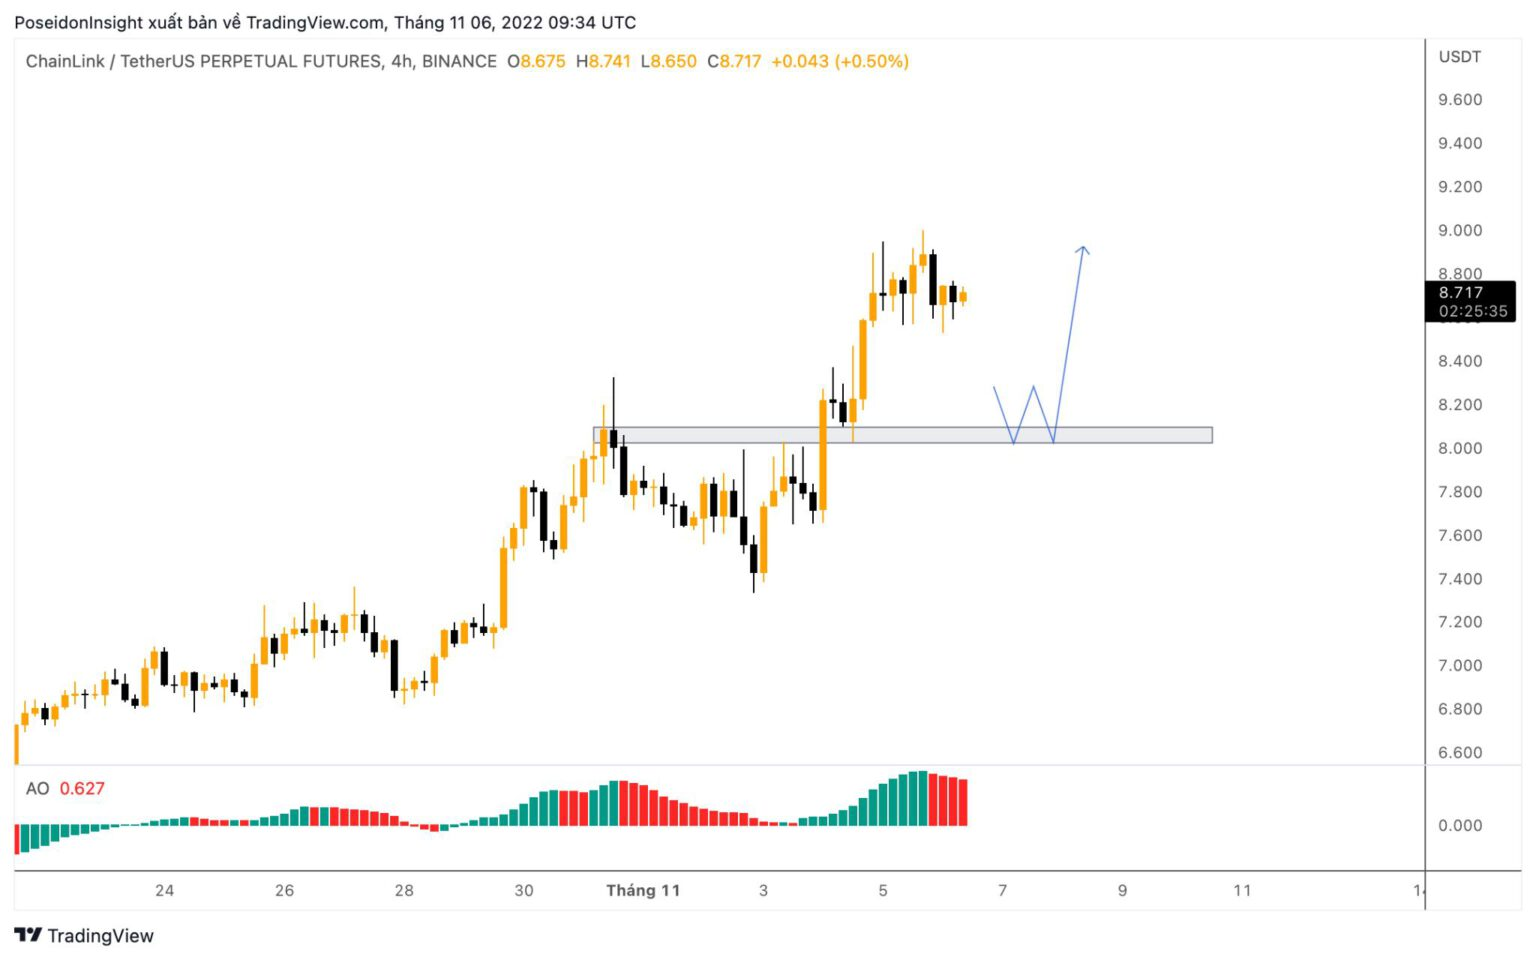
4H Chart of LINK/USDT on Binance Futures, screenshot from TradingView as of 11/13/2022
Results: LINK hit entry and achieved a +15% profit.
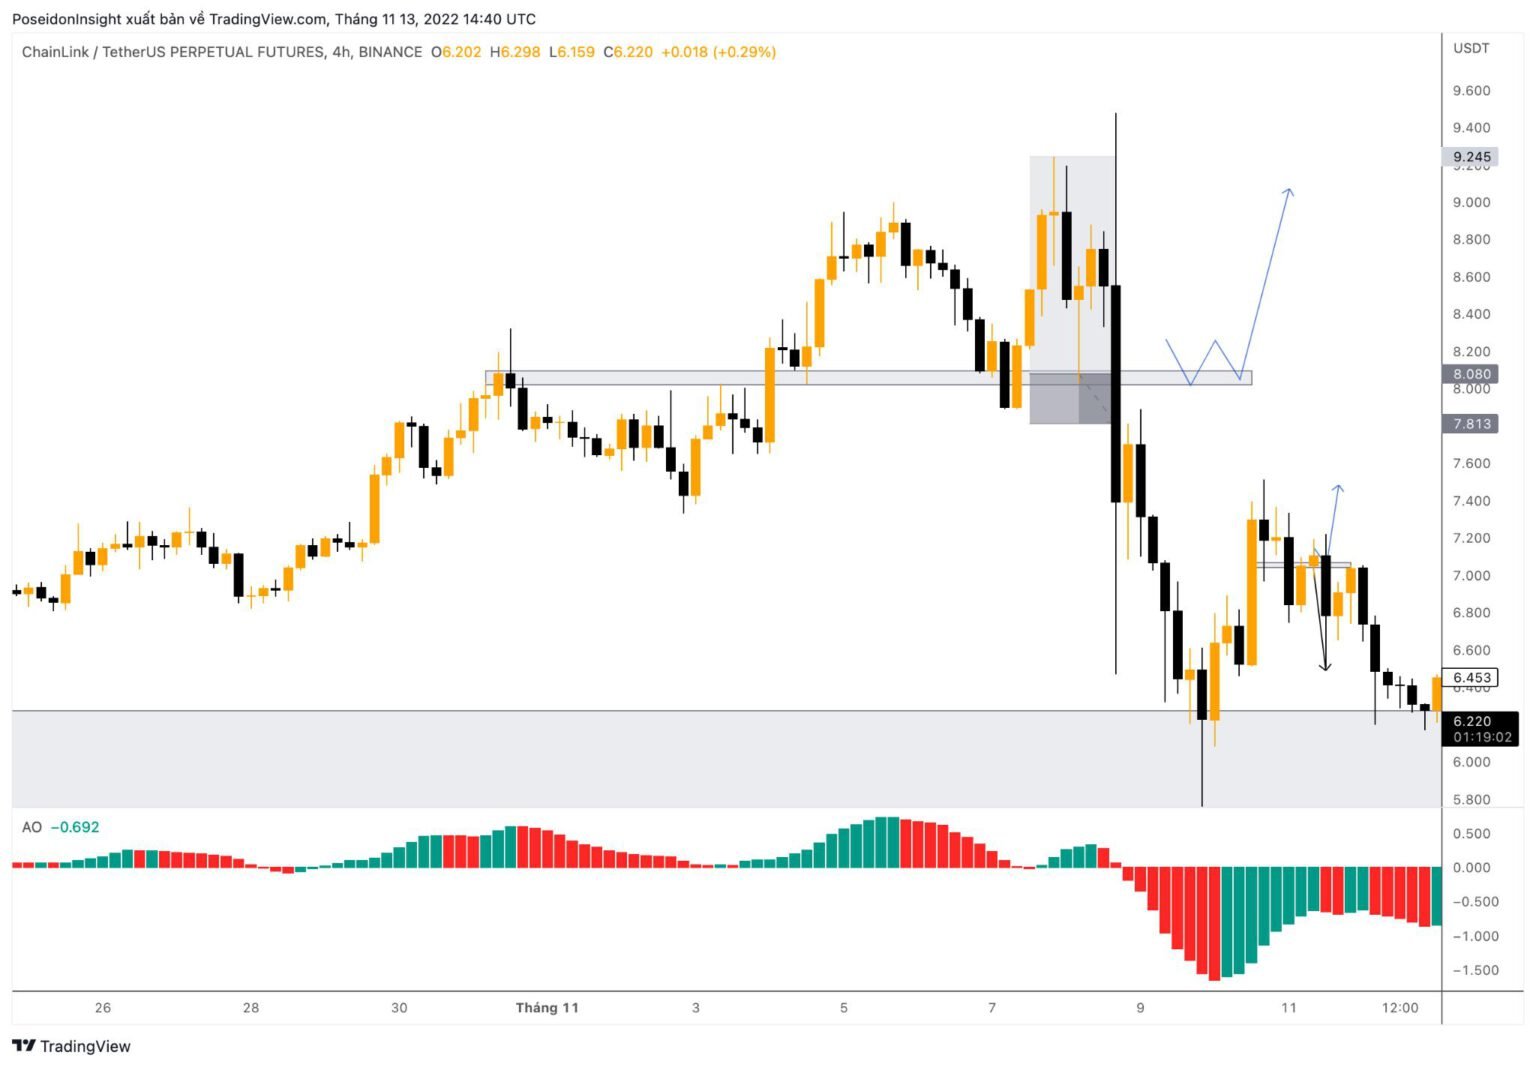
4H Chart of LINK/USDT on Binance Futures, screenshot from TradingView as of 11/13/2022
Trading Plan for This Week
Bitcoin (BTC) Analysis
On the weekly timeframe, the selling pressure has completely overwhelmed after a period of sideways movement. We saw a nearly full red candle from $20,900 down to $16,600, marking one of the largest ranges in recent times.
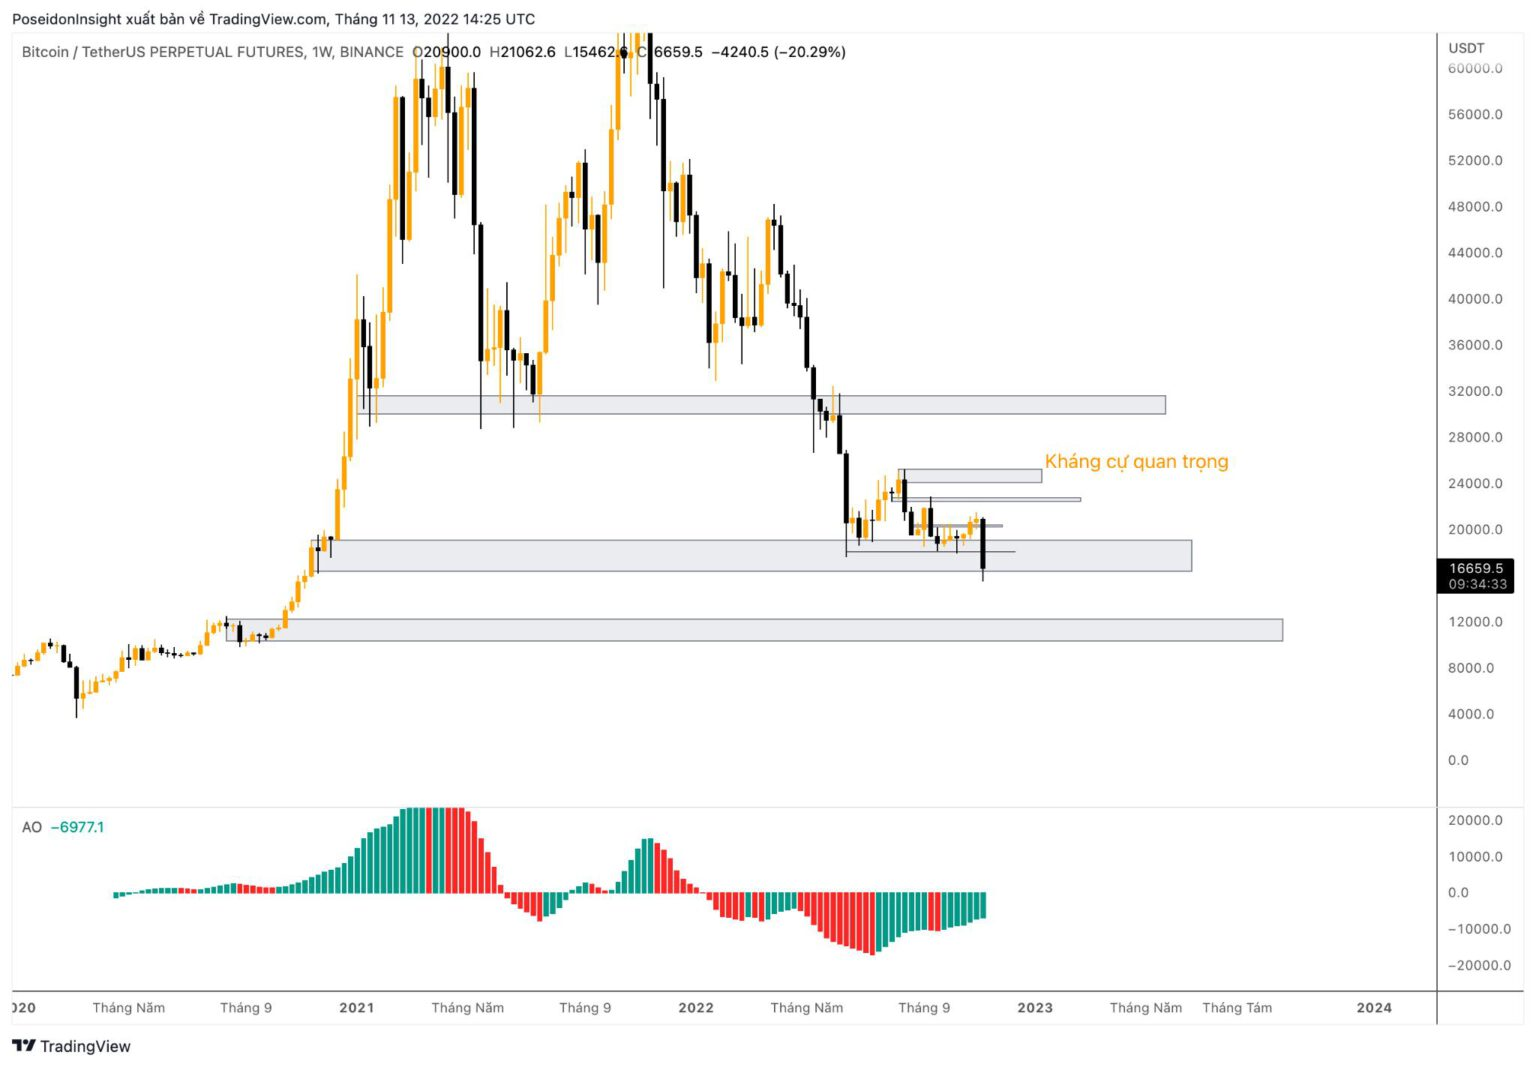
1W Chart of BTC/USDT on Binance Futures, screenshot from TradingView as of 11/13/2022
It seems like the market has broken out of the sideways price range following continuous negative news related to the FTX collapse and the ongoing impact of the FED's rate hikes.
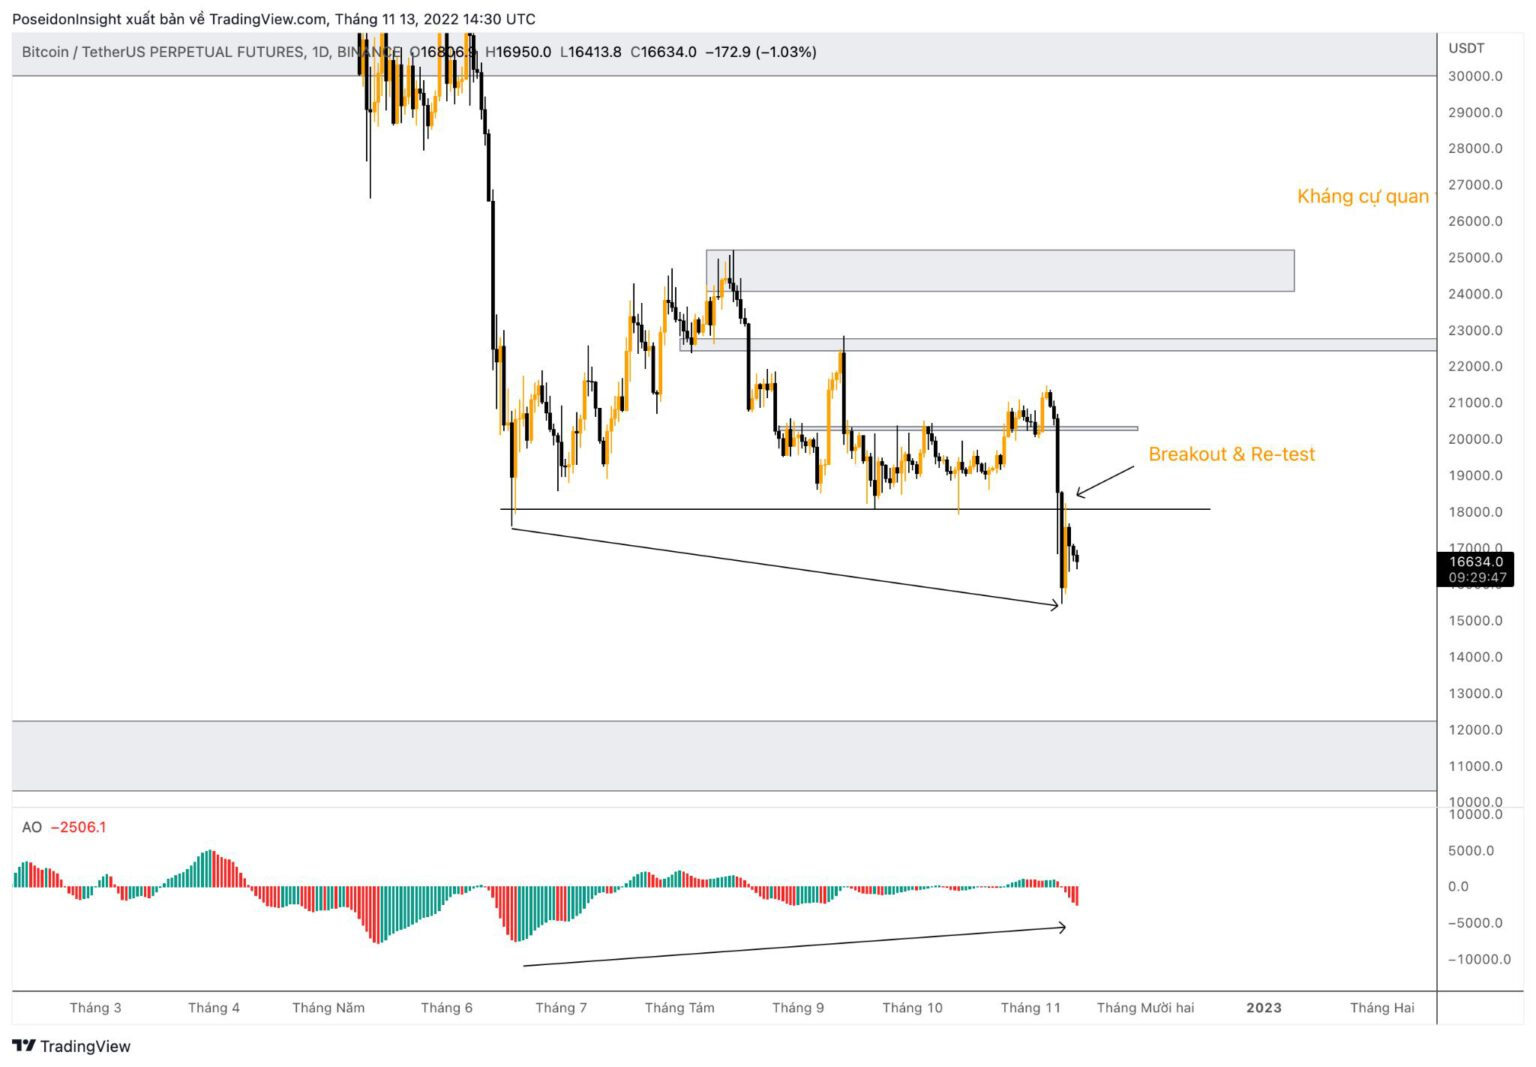
1D Chart of BTC/USDT on Binance Futures, screenshot from TradingView as of 11/13/2022
This timeframe has me a bit puzzled in making predictions. Firstly, you can see that the price has broken below the previous support and successfully re-tested it, indicating a strong bearish trend. However, the price and the Awesome Oscillator (AO) are showing a potential bullish divergence: price is making lower lows while AO is making higher lows. Typically, a divergence like this could signal a potential bounce or even a reversal. Yet, given the current market conditions, this scenario is less likely to materialize.

4H Chart of BTC/USDT on Binance Futures, screenshot from TradingView as of 11/13/2022
For those of you into scalping, it's important to recognize that after such dumps, the market may fall into a sideways range. Therefore, you could consider scalping within a range (I predict 16,300 – 18,000). Alternatively, for a safer approach, wait for the price to break out of these two levels before entering a trade as suggested.
The 4H chart has started showing the first signs of divergence (using AO to measure this). I anticipate another pump to sweep liquidity in the demand zone before entering a short position.
Of course, if this short trade succeeds, it doesn’t mean BTC will experience a significant drop. Remember, we are currently in a sideways market cycle.
In my view, it’s still too early to declare that this is the BTC bottom and prepare for a new cycle.
BTC.D (Bitcoin Dominance)
BTC.D has maintained its support level. With Bitcoin's sharp decline this week, BTC.D could rebound, making altcoins face more difficulties. Therefore, consider reducing your altcoin trading during this period.
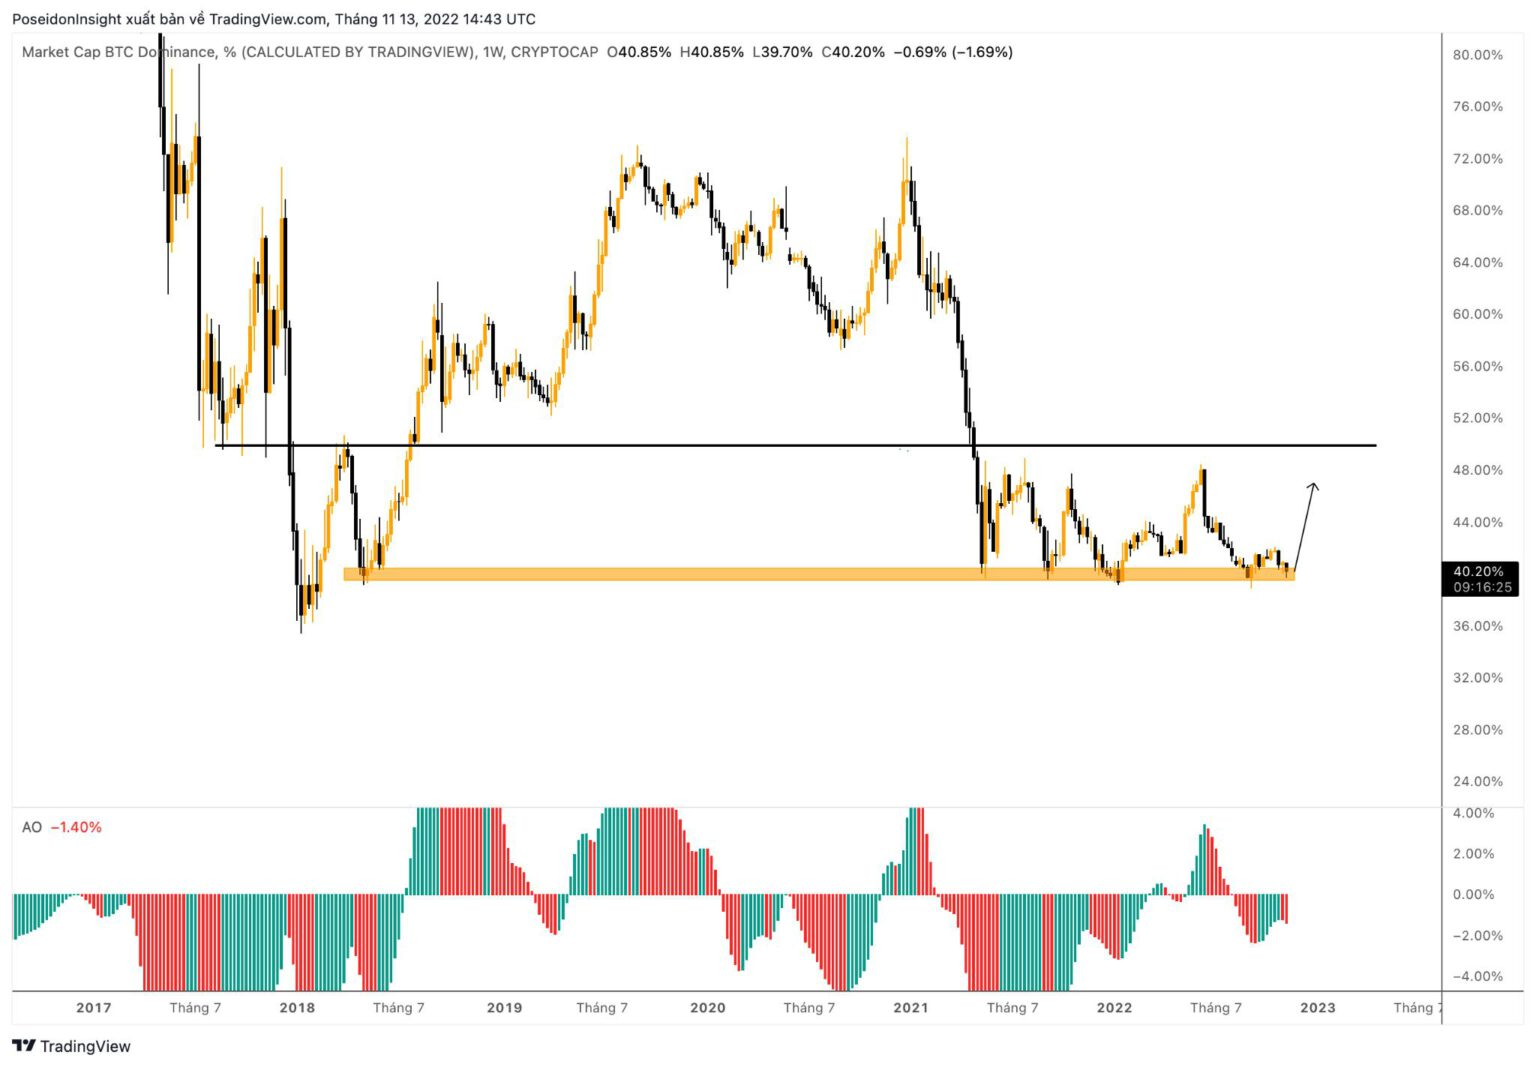
BTC Dominance Chart, screenshot from TradingView as of 11/13/2022
Some Altcoin Plans
ETH
ETH is still respecting the support zone on the daily timeframe at $1,239. In my view, ETH will likely move sideways for the next few days. The price has created three progressively lower peaks from this support zone, indicating weakening buying pressure. Therefore, after moving sideways, the price is likely to break down. You might consider waiting for a short entry.

1D Chart of ETH/USDT on Binance Futures, screenshot from TradingView as of 11/13/2022
DYDX
After the FTX incident, decentralized exchanges like DYDX are gaining attention for their decentralized nature. As a result, DYDX has more than doubled from its low last week. The weekly chart of DYDX looks strong, with two bottoms and a weekly candle almost clearing stop-losses. However, buying at this level means our stop-loss will be quite far.
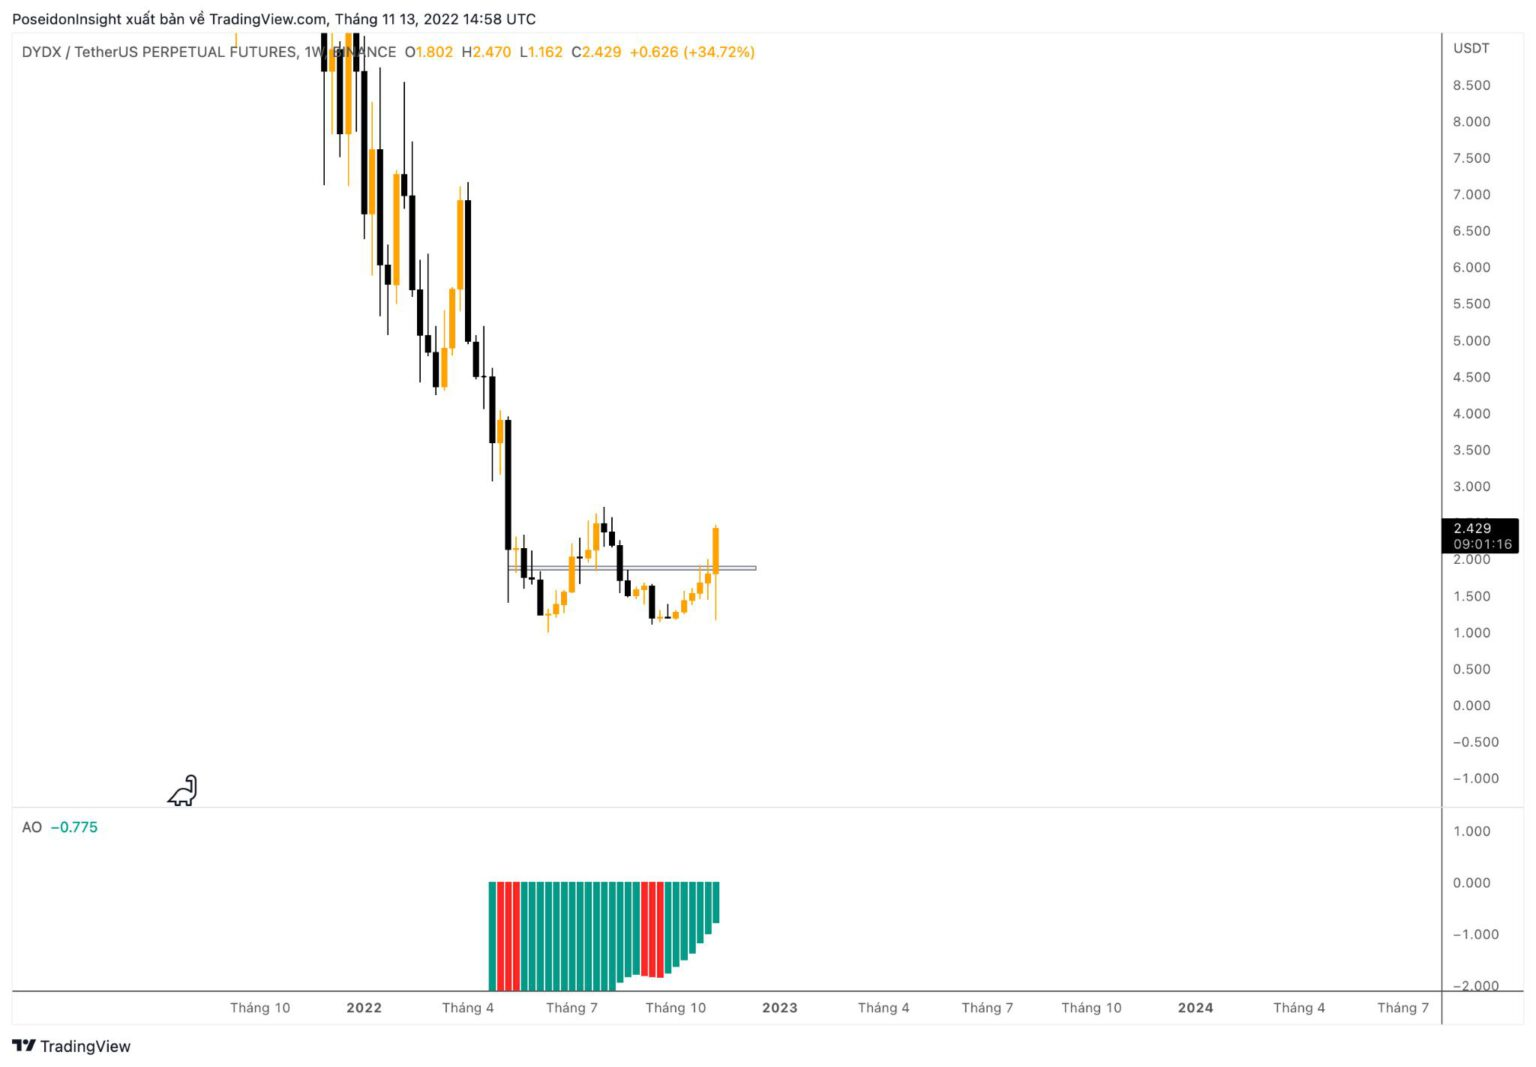
1W Chart of DYDX/USDT on Binance Futures, screenshot from TradingView as of 11/13/2022
My plan is to wait for DYDX to correct on a smaller timeframe, around $2.0 – $2.2, before entering a buy position.
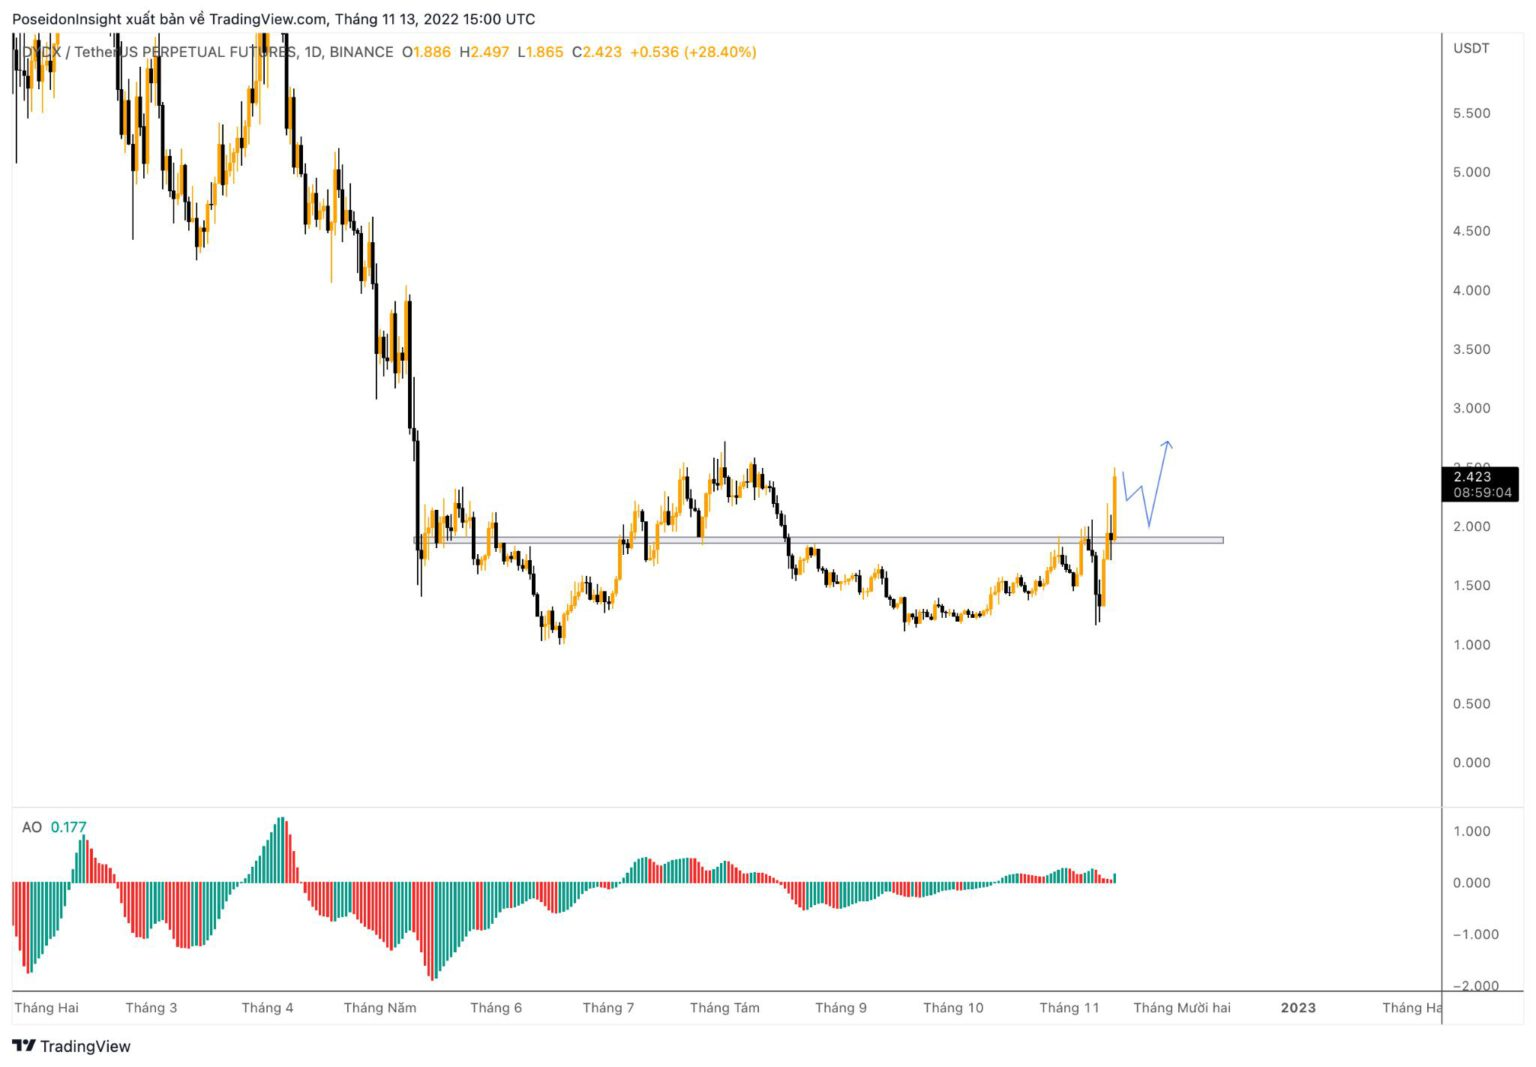
1D Chart of DYDX/USDT on Binance Futures, screenshot from TradingView as of 11/13/2022
Macro News
Last week, the CPI news was more favorable, coming in lower than expected. Gold and the US stock market experienced a decent rebound. However, Bitcoin, burdened by numerous negative developments related to the FTX collapse, failed to show a strong rebound and even saw a significant dump.
This week, there are several important news items:
- On November 15 at 20:30 (Vietnam time), the US will release the Producer Price Index (PPI). This is an important measure of inflation in the economy.
- On November 16 at 20:30, the US will release the Core Retail Sales (CRS) index. This measures changes in the total value of retail sales in the US (excluding automobiles). This index will reflect the economic development and impact the FED's interest rate decisions in December.
Conclusion
These are some trading plans from my perspective. I hope they provide you with additional insights to trade better in the upcoming week. Don’t forget to join the 68 Trading group on Telegram to trade and chat with us!