68 Trading Plan (12/26/2022 – 01/01/2023) – Time to Rest

As we approach the end of the year, it’s a time for all of us to take a break. Consequently, the market has seen little significant movement over the past week. BTC’s price range has been limited to about $100 – $200 per day, making trading challenging during this period.

Review of Last Week’s Trading Results
Check out: 68 Trading Plan (12/19/2022 – 12/25/2022) – When Will the Bottom Hit?
BTC Trading Plan
Last week’s scalping plan for BTC:
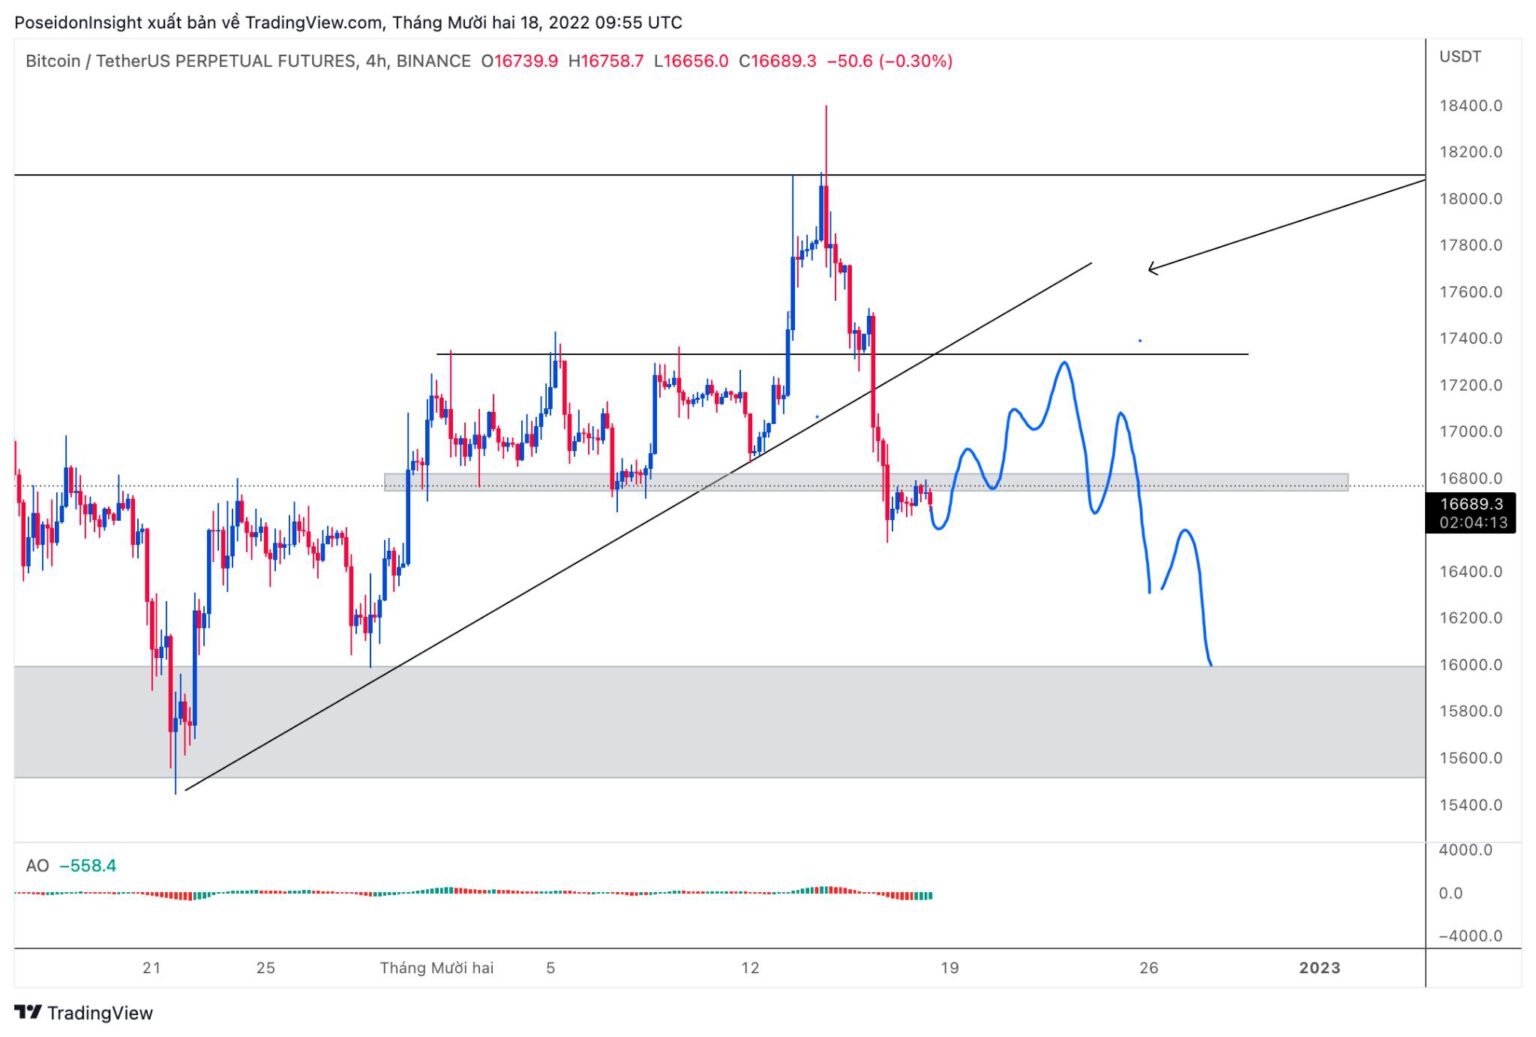
Results: The price did test the $16,500 level and bounced back as expected. However, the short entry at $17,200 was not executed since BTC remained in a sideways range around $16,800.
ETH Trading Plan
Similarly, ETH had a short plan at the $1,234 level, and the entry was executed.
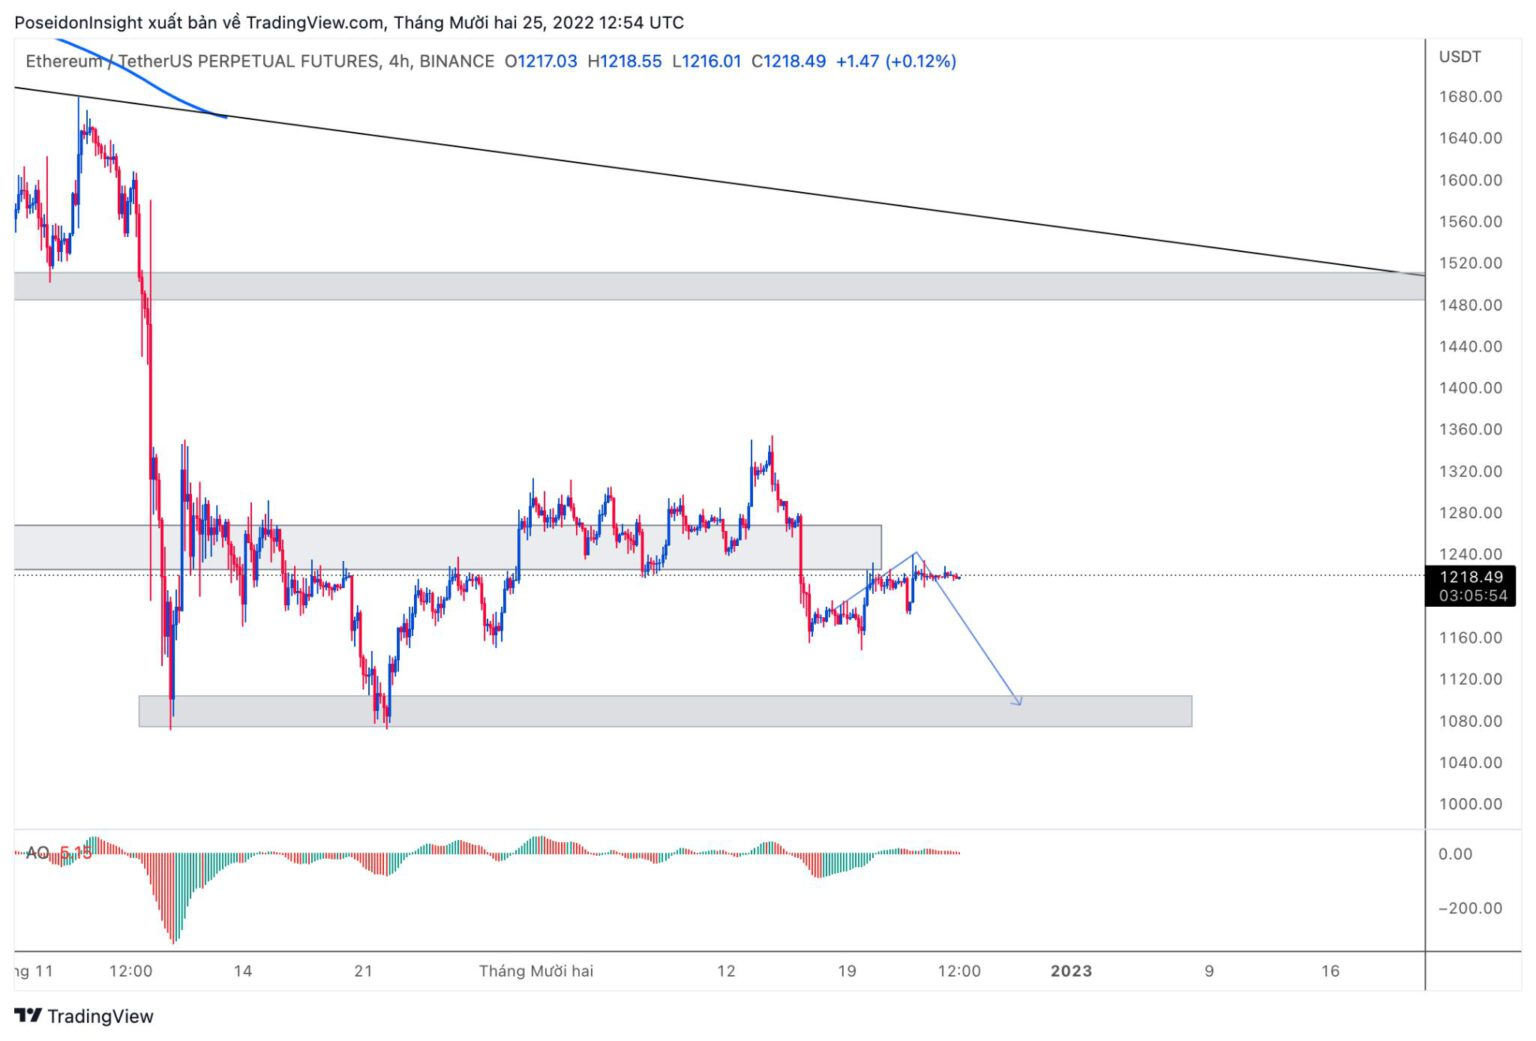
Currently, the price has not dropped but is simply moving sideways around this level. To mitigate risk, you might consider closing the position early or setting a stop loss at entry.
Join the 68 Trading community for more quality trade setups!
Bitcoin (BTC) Analysis for This Week
The weekly chart remains dull. With this week’s green candle likely closing at $16,800, the price is showing indecision. Combined with last week’s candle, we observe balanced selling and buying pressure, keeping BTC within a range of $15,900 – $18,000. Given the holiday season in many countries, significant price movements are unlikely. Patience will be crucial for those looking to trade in the coming weeks.
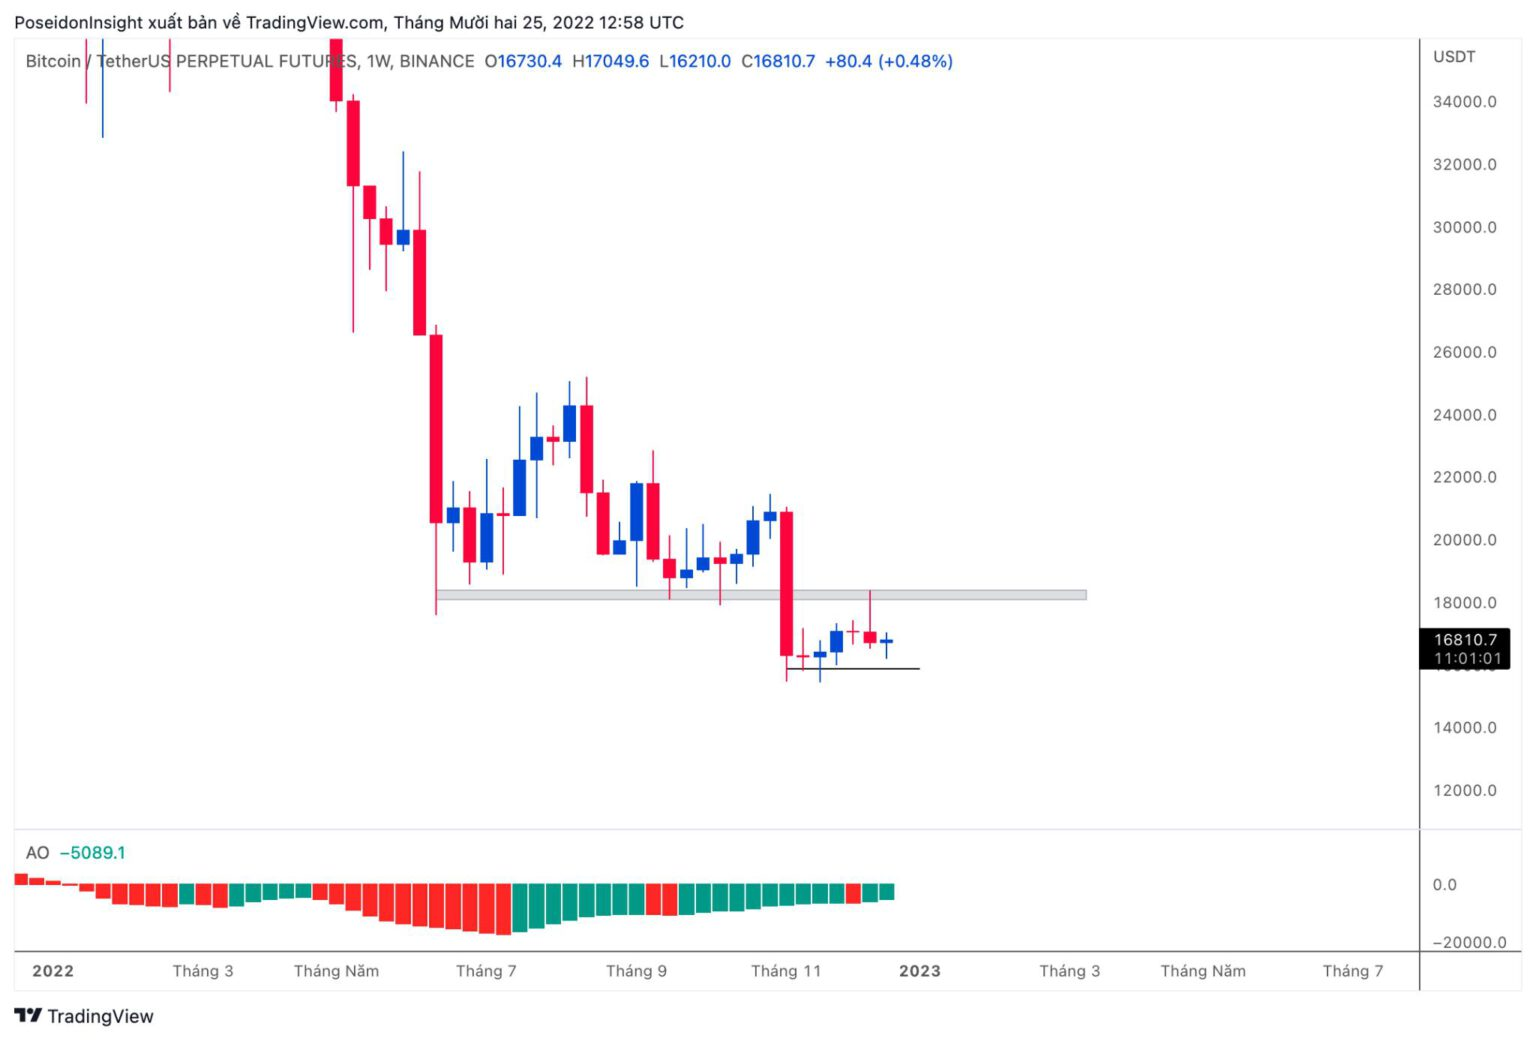
Weekly Chart for BTC/USDT on Binance Futures, Screenshot from TradingView on 12/25/2022
The daily chart provides a clearer view of the recent sideways action. Over the past 5 days, BTC has shown minimal movement. Previously, despite strong selling pressure near $18,400, it wasn’t sufficient, and last week’s strong green candle only led to sideways price action.
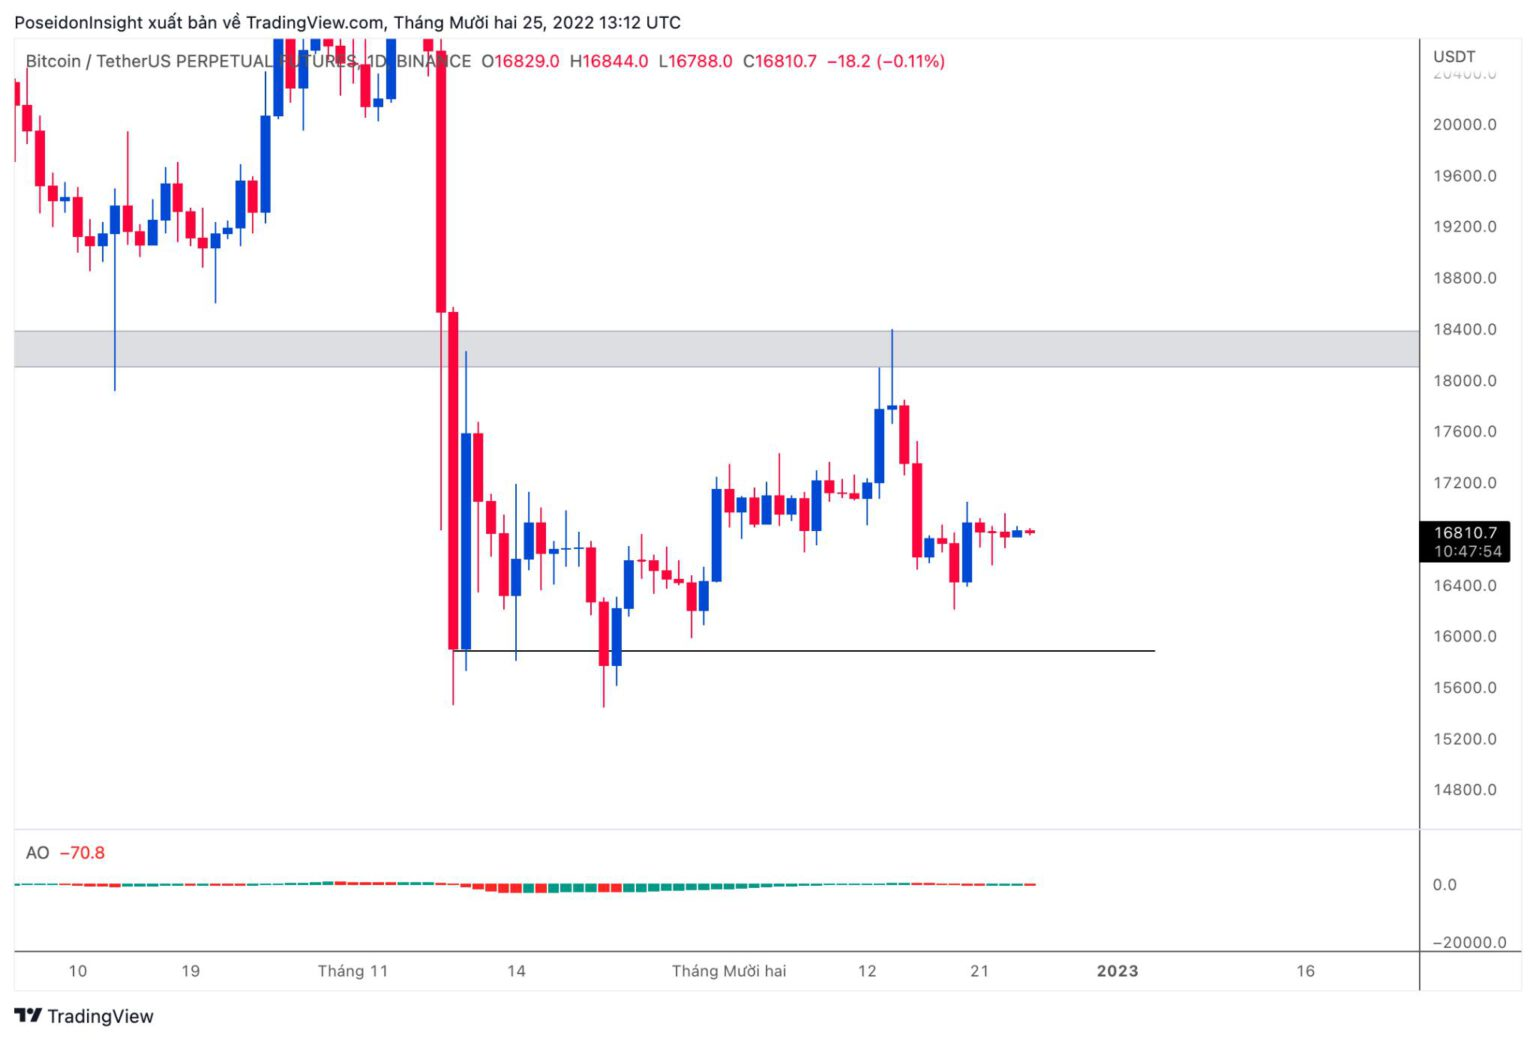
Daily Chart for BTC/USDT on Binance Futures, Screenshot from TradingView on 12/25/2022
The 4-hour chart shows a very dull market. For the upcoming week, we’ll consider shorting if BTC experiences a fake pump to $17,400.
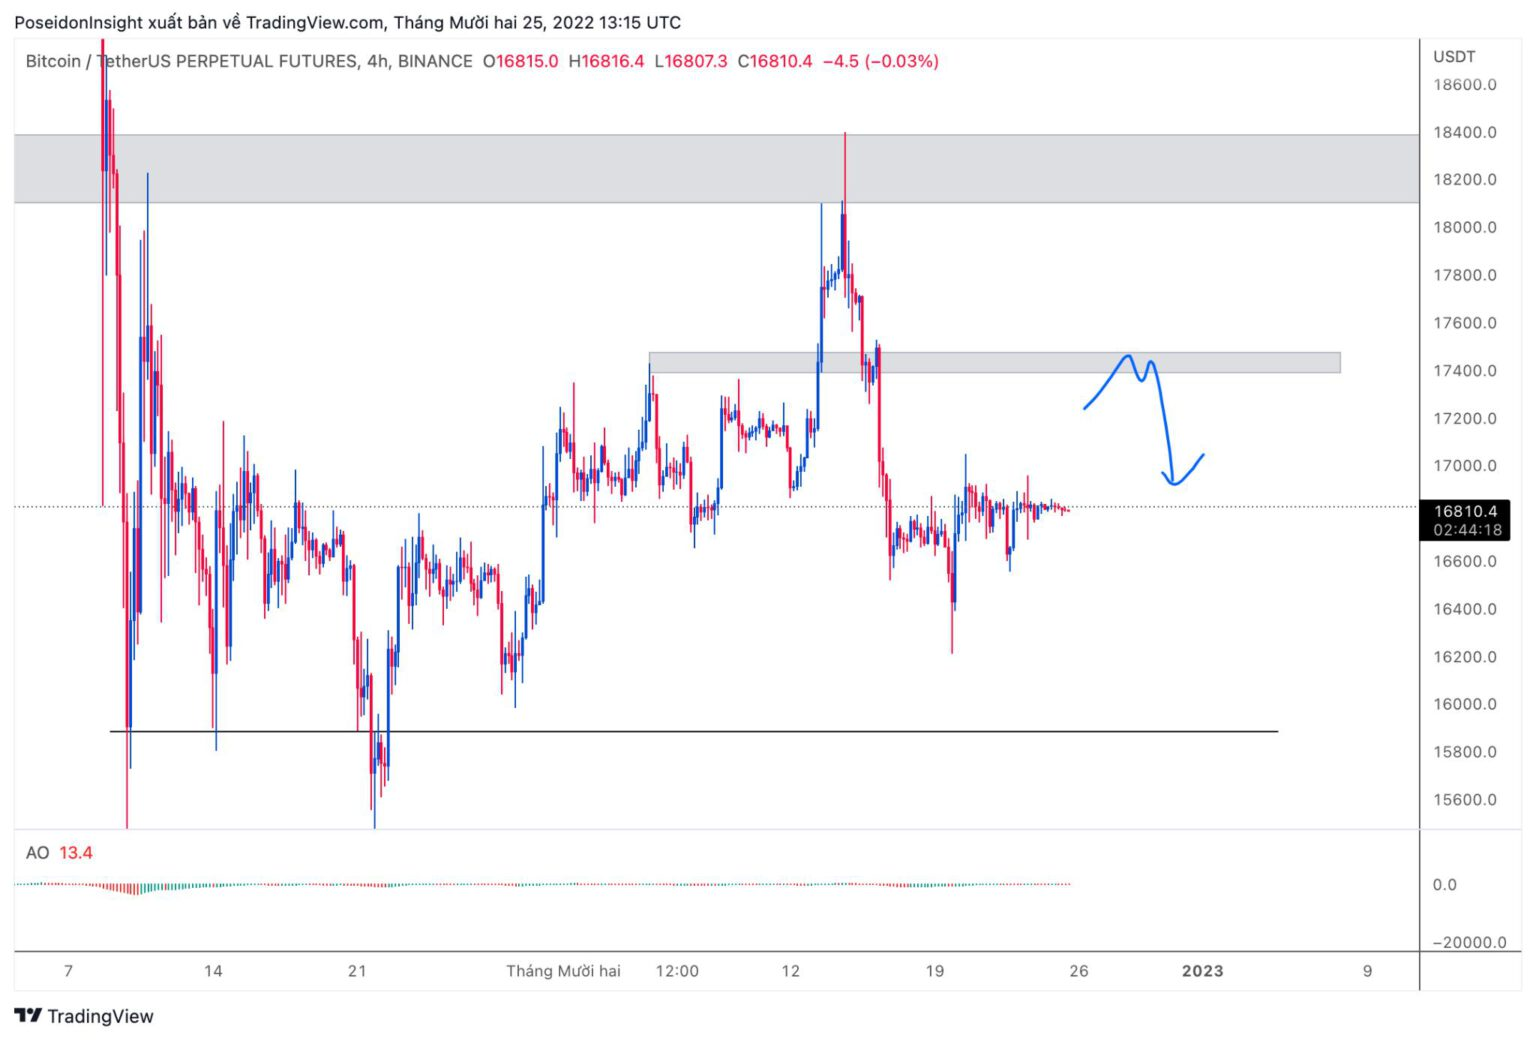
4-Hour Chart for BTC/USDT on Binance Futures, Screenshot from TradingView on 12/25/2022
BTC.D (Bitcoin Dominance)
The long-term plan for BTC.D is still performing well. BTC.D has risen following BTC’s dump and may continue to increase. Thus, be prepared for potentially weaker performance from altcoins in the near term.
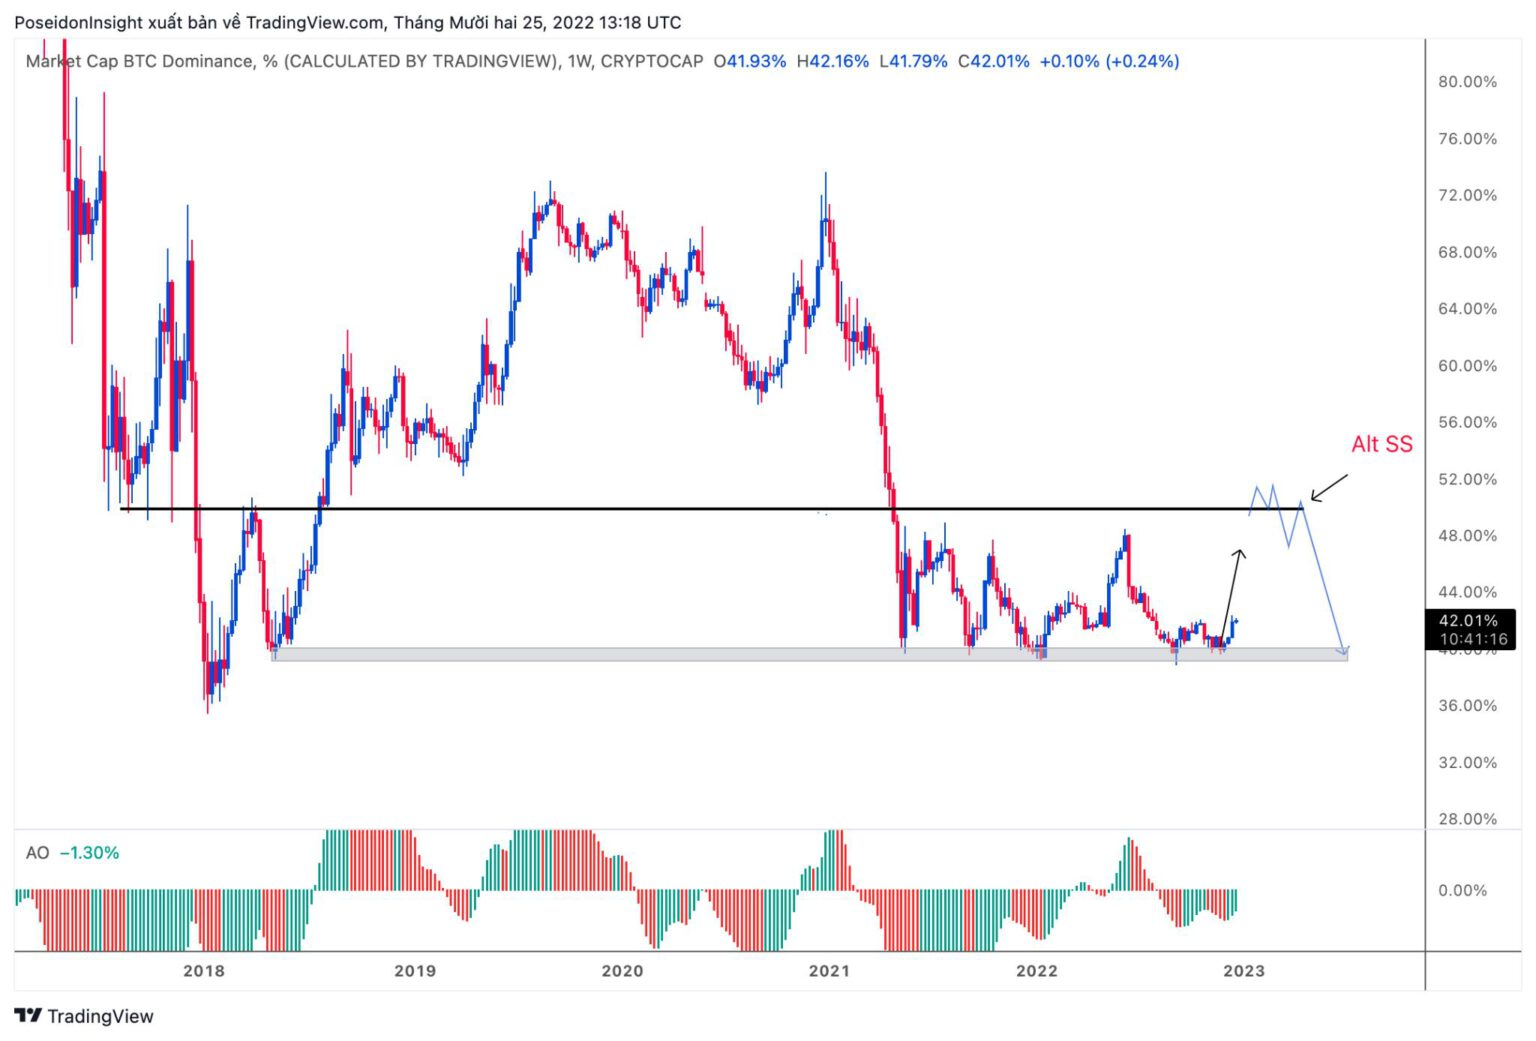
Bitcoin Dominance Chart vs. Total Crypto Market Cap, Screenshot from TradingView on 12/25/2022
Some Plans for Altcoins
Plan for OP
For OP, the chart shows clearer signs of a dump, with the price breaking out of the trendline on the daily chart and successfully retesting. For a good trade setup, wait for the price to break the final support at $0.835, then retest and short. Although this plan is based on the daily chart, use the 4-hour chart for better short entries.
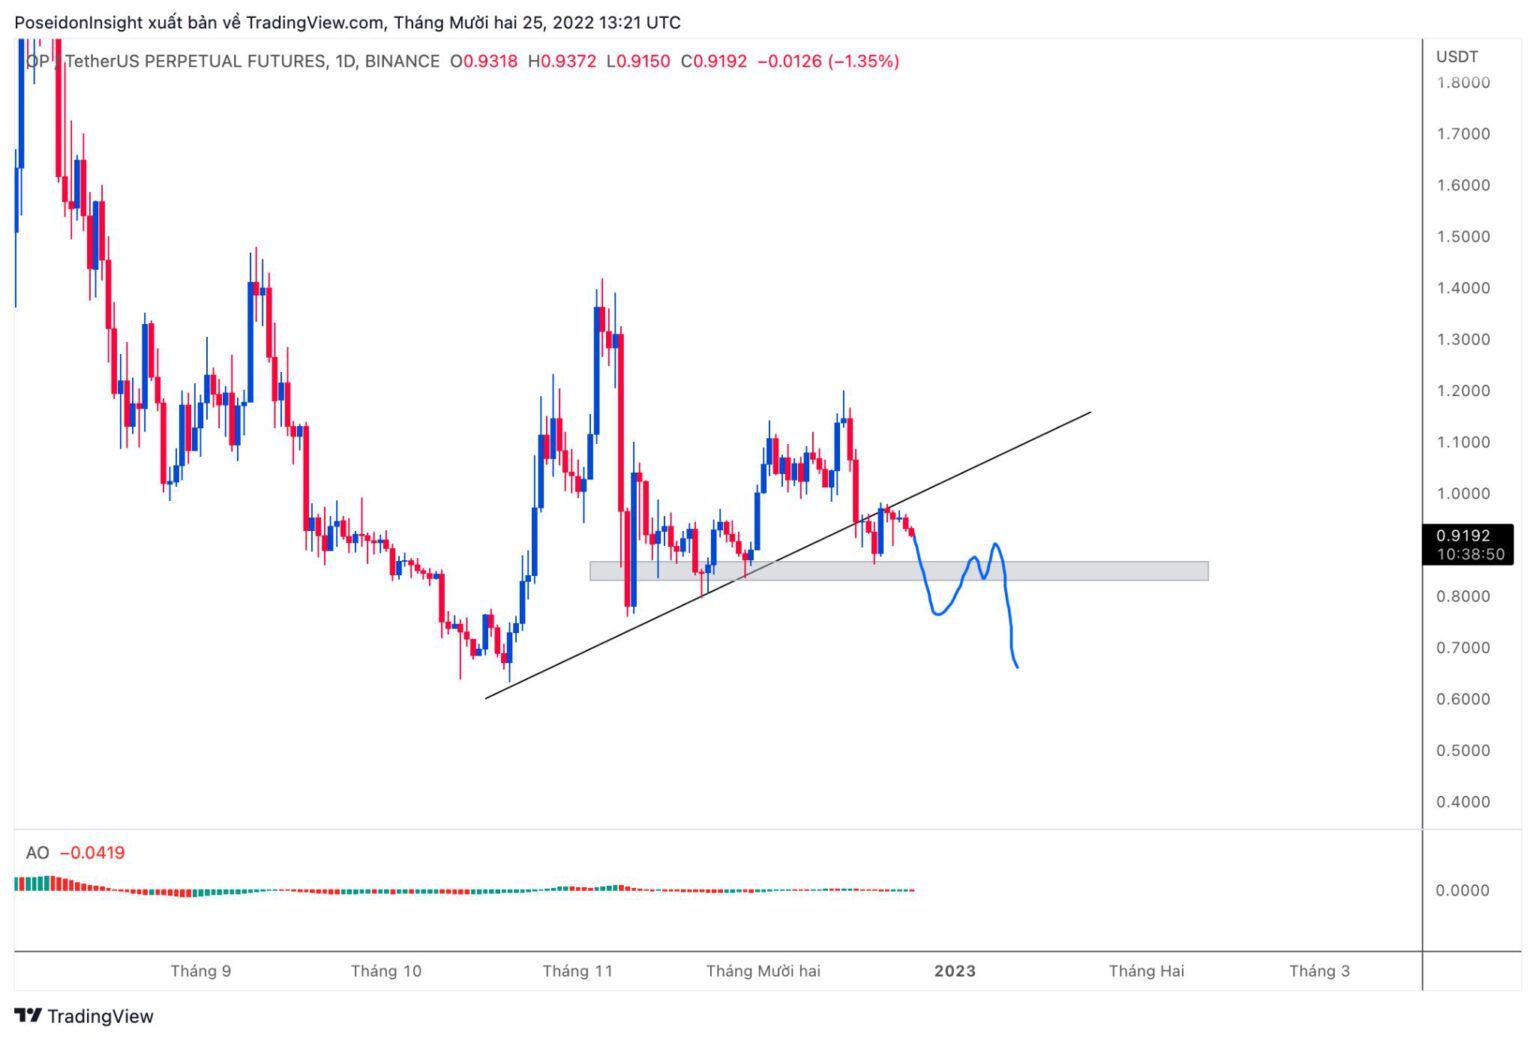
Daily Chart for OP/USDT on Binance Futures, Screenshot from TradingView on 12/25/2022
Macroeconomic News
Next week, there are unlikely to be significant macroeconomic news. On December 26-27, the market might continue moving sideways as many countries are still on holiday.
Conclusion
These are some personal trading plans and perspectives. I hope you find them useful for your trading decisions in the coming week. Don’t forget to join 68 Trading to trade and chat with us!