68 Trading Plan (December 19, 2022 – December 25, 2022) – When Will the Bottom Be?

Hey everyone, last week was challenging for all of us, with many "bull traps" followed by sharp declines and sideways movement. Let’s review the past week’s trading and plan for the upcoming one!

68 Trading Plan (December 19, 2022 – December 25, 2022) – When Will the Bottom Be?
Review of Last Week's Trading Results
Plan for BTC
Trading Strategy: Last week’s plan was to wait for BTC to break out of the sideways range before shorting.
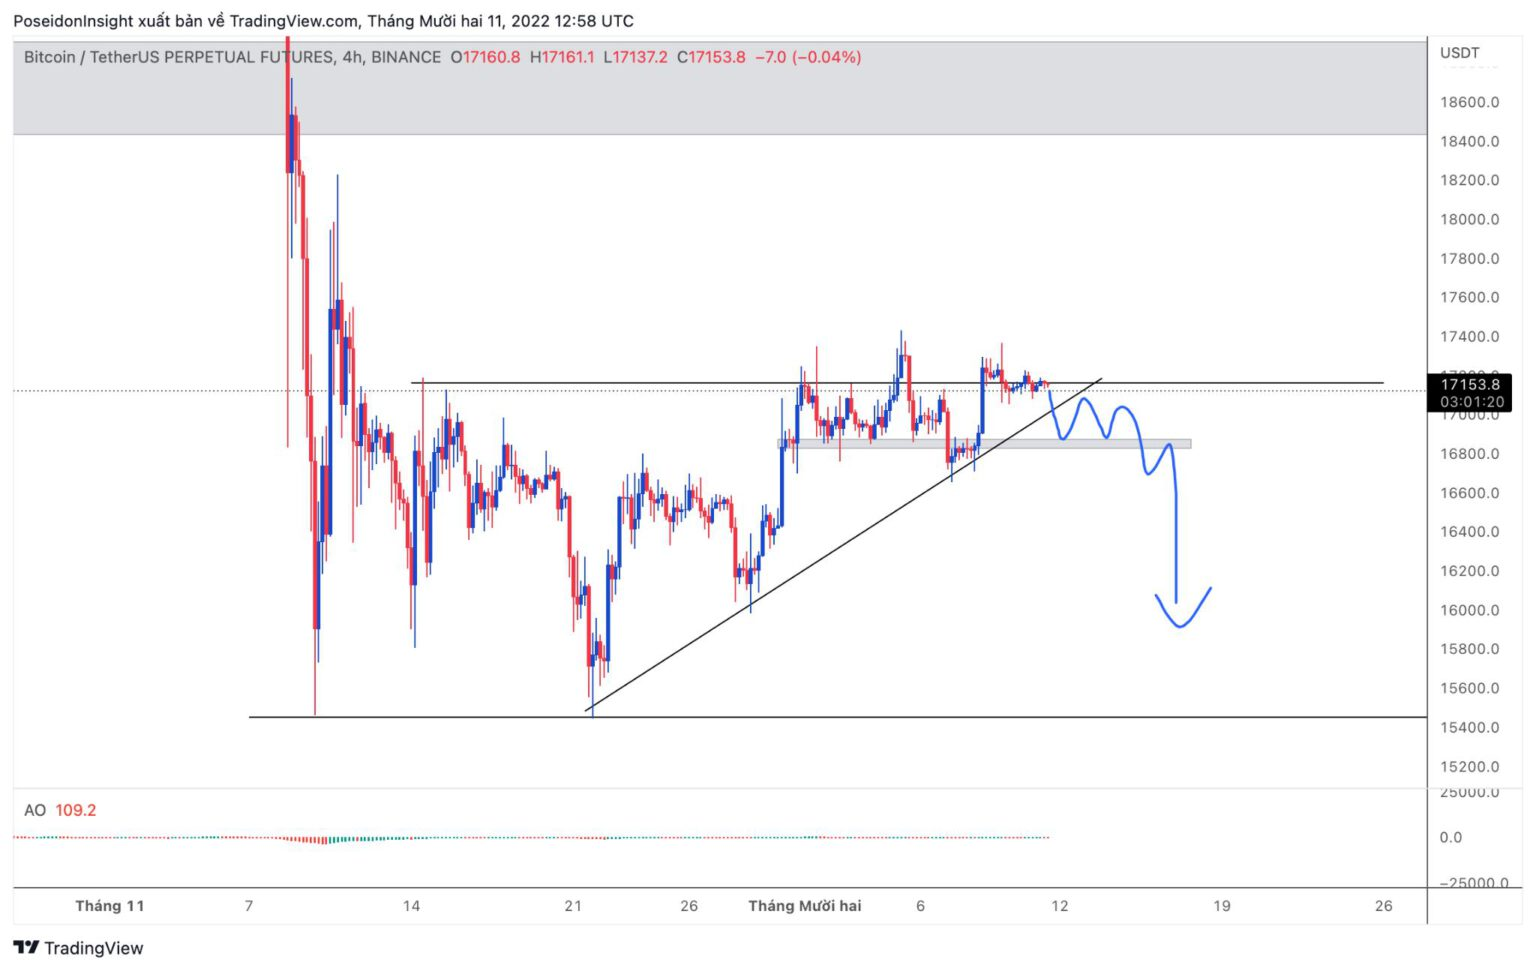
4h BTC/USDT Chart on Binance Futures, Screenshot from TradingView on the Evening of December 18, 2022
In practice, the price did drop significantly as expected. However, it first created a "bull trap" by spiking up to $18,500 before falling.
As a result, our short plan didn’t execute as intended.

4h BTC/USDT Chart on Binance Futures, Screenshot from TradingView on the Evening of December 18, 2022
Plan for BNB
Trading Strategy:

4h BNB/USDT Chart on Binance Futures, Screenshot from TradingView on the Evening of December 18, 2022
Our plan was to buy BNB around $274. However, heavy FUD surrounding Binance last week derailed this plan. You can check out the FUD details related to Binance in this article.
Plan for LINK
Trading Strategy: We aimed to short LINK.
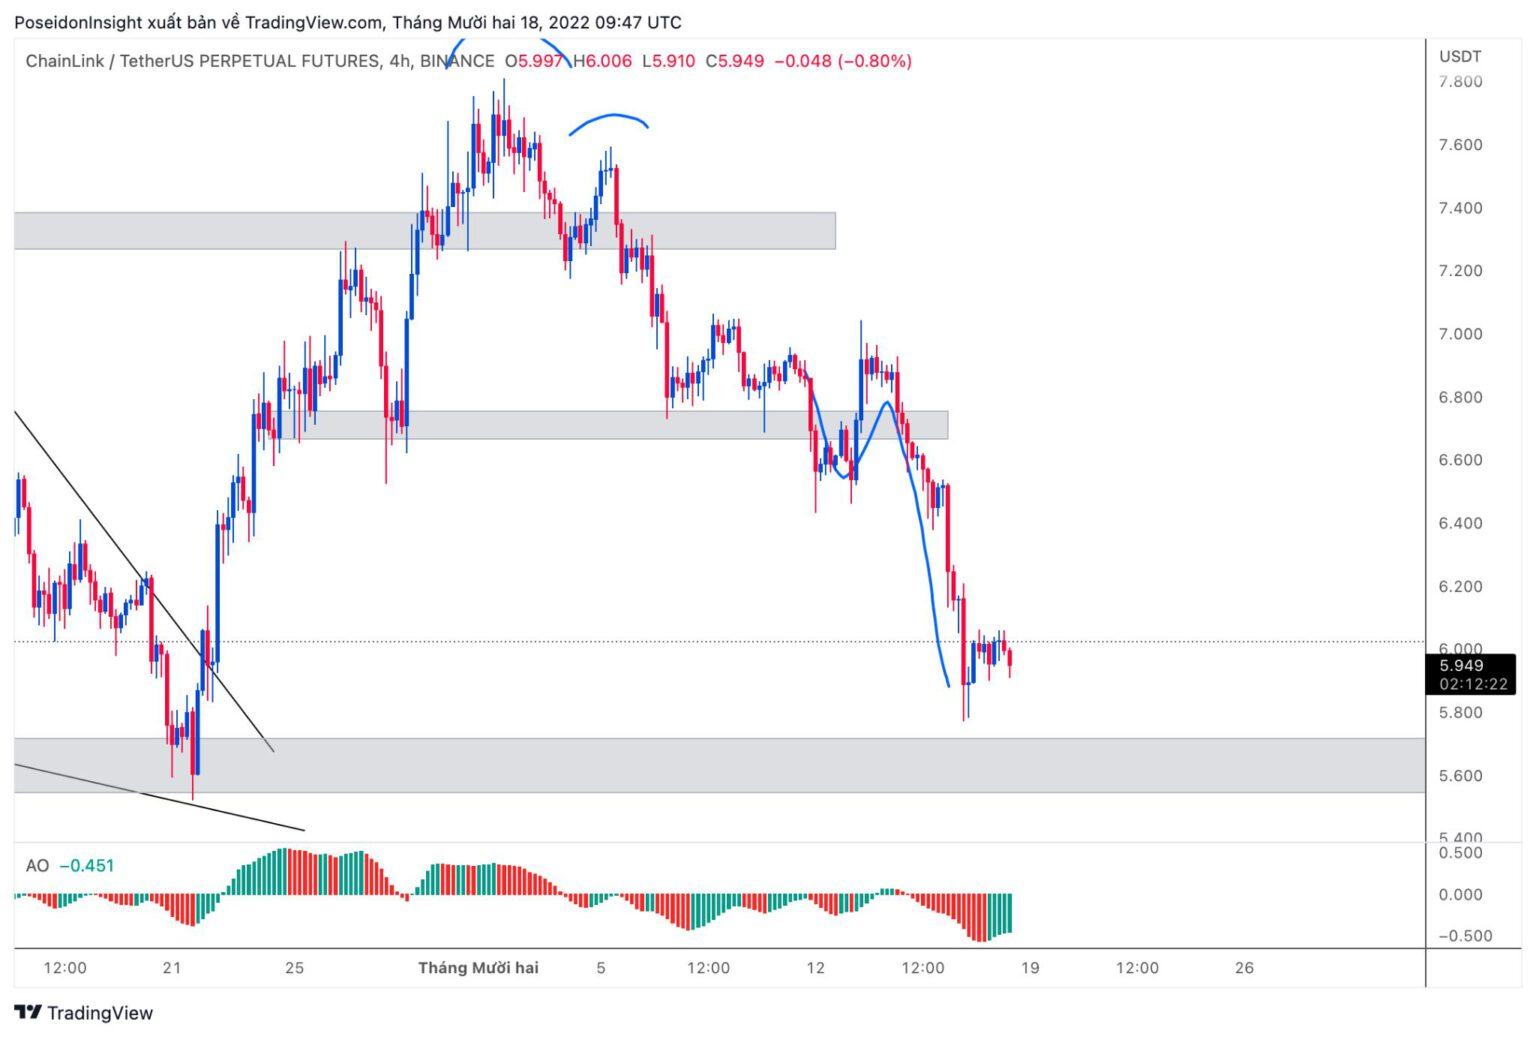
4h LINK/USDT Chart on Binance Futures, Screenshot from TradingView on the Evening of December 18, 2022
This was the only plan that worked. However, the price action was very frustrating, as it didn’t re-test the broken support but instead created a bull trap (with a double bottom price model) before dropping again below the support level.
Join the 68 Trading community to get more quality trade setups!
Trading Plan for This Week
Bitcoin (BTC) Analysis and Outlook
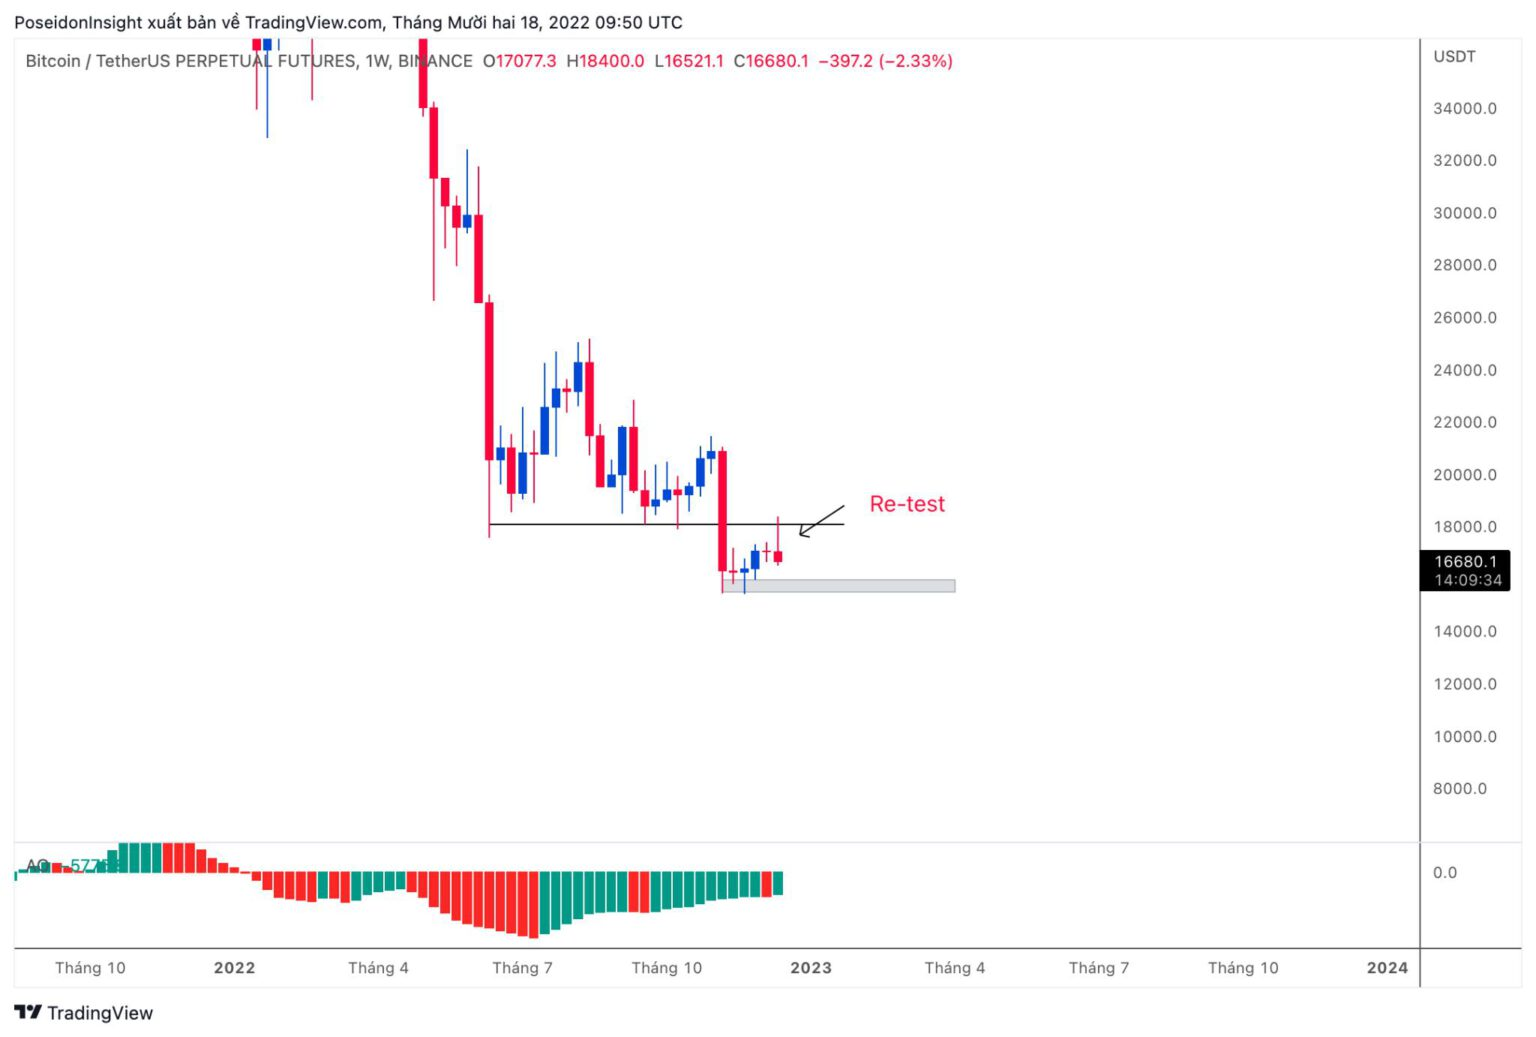
1W BTC/USDT Chart on Binance Futures, Screenshot from TradingView on the Evening of December 18, 2022
The weekly chart for BTC is clearer this time. After a sharp drop that broke the $18,000 support, the price re-tested this level, and the current weekly candle pattern shows strong price rejection. Currently, BTC’s only temporary support is in the $15,700 – $16,000 range. If this level is breached, the price could drop further.
A positive sign is that the AO indicator has created a bullish divergence with the price chart. However, we still need to wait for confirmation to see if this is indeed the bottom.
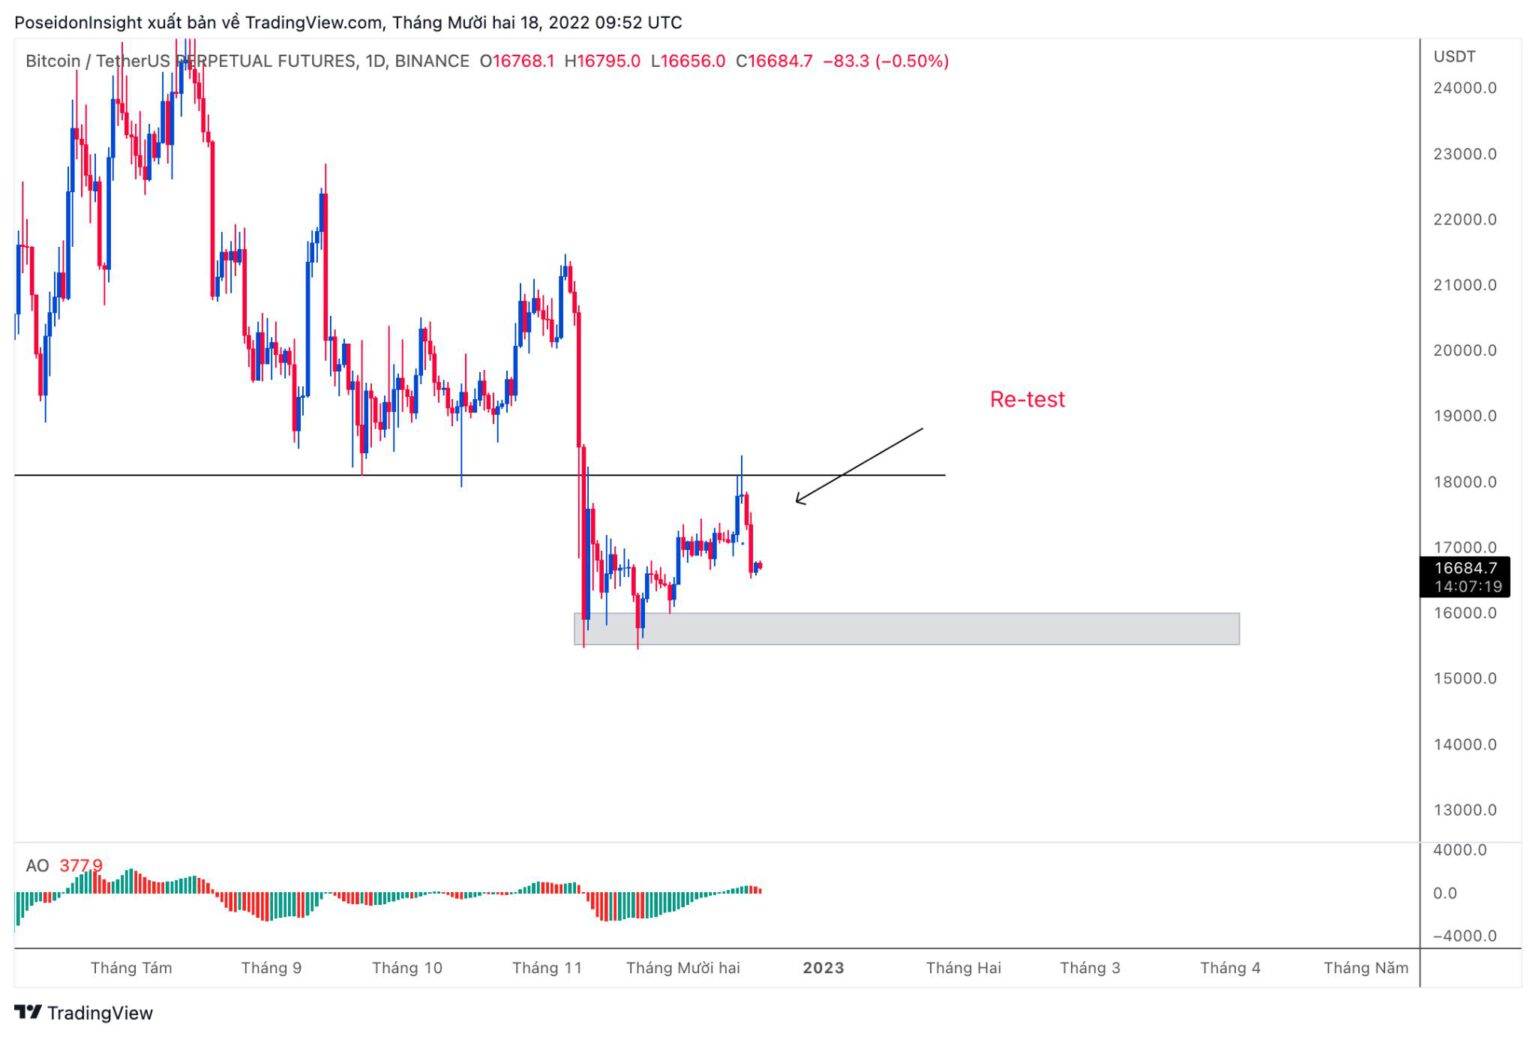
1D BTC/USDT Chart on Binance Futures, Screenshot from TradingView on the Evening of December 18, 2022
On the daily chart, BTC is forming a sideways range from $15,700 to $18,500. The recent candles show strong selling pressure (with consecutive engulfing red candles, with the second candle long and closing lower than the previous one) => selling pressure remains high, and market sentiment is currently bearish.
For those interested in scalping, here’s a suggested 4-hour trading plan:

4h BTC/USDT Chart on Binance Futures, Screenshot from TradingView on the Evening of December 18, 2022
Trading Plan:
- Focus on shorting rather than longing.
- Since the price has dumped significantly, avoid chasing shorts. Wait for a price rebound to the $17,300 – $17,400 range, then short if the price fails to break higher and instead dumps further. Enter short at around $17,200. Of course, if the price rebounds to $17,300 – $17,400, you can still consider a high-risk entry at this level.
- This plan might not work if the price continues to dump and breaches the temporary 4H support at $16,500. Stay flexible to make better entries.
BTC.D (Bitcoin Dominance)
The long-term BTC.D plan is performing well. BTC.D has risen after BTC’s dump and may continue to rise. Therefore, be prepared for potentially poor performance from altcoins in the near future.
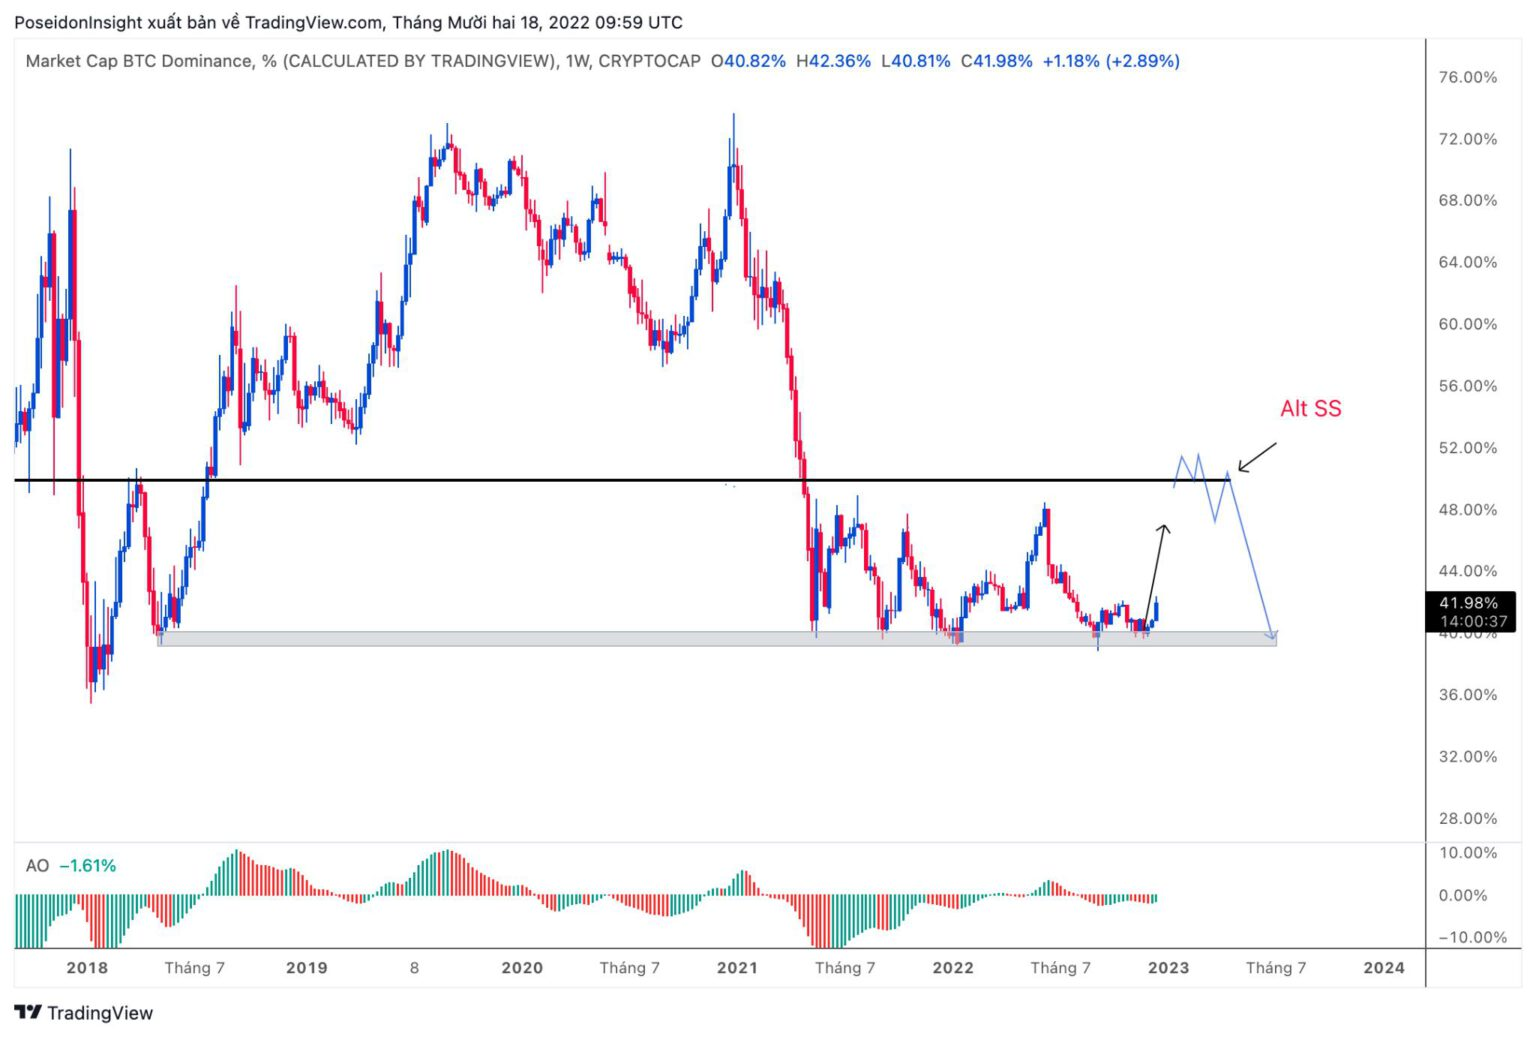
Bitcoin Dominance Chart Compared to Total Crypto Market Cap, Screenshot from TradingView on the Evening of December 18, 2022
Altcoin Plans
ETH
ETH has also experienced a fake breakout. Consider waiting for the price to test resistance around $1,229 for a short entry. Target the support area at $1,080 for taking profits.

1D ETH/USDT Chart on Binance Futures, Screenshot from TradingView on the Evening of December 18, 2022
PEOPLE
PEOPLE is still showing solid accumulation. You might consider buying spot in the $0.14 – $0.15 range if the price revisits this level to accumulate and await a new pump. The stop-loss for this plan will be if the price closes below the support level.

1W PEOPLE/USDT Chart on Binance Futures, Screenshot from TradingView on the Evening of December 18, 2022
Macro News
This week, there aren't many major news events. Pay attention to consumer confidence data from CB on December 21 (at 21:00) and U.S. GDP figures on December 22 (at 20:30). The following days will overlap with the Christmas holiday in the U.S. and many other countries, so expect low market volatility over the weekend.
Summary
Here are a few trading plans from my perspective. I hope you find them useful for the upcoming week. Don’t forget to join the 68 Trading group on Telegram to trade and chat with us!