
Bitcoin Price Analysis for September 1, 2022

Bitcoin has been extremely volatile recently, resulting in some frustrating price swings. In this analysis, 68Trading will provide a personal outlook on Bitcoin's trend for September.

Monthly Chart (1M)
The August candle has closed, showing a significant bearish move with trading volume exceeding that of July. This indicates that the selling pressure is still dominant, and the overall trend remains bearish.
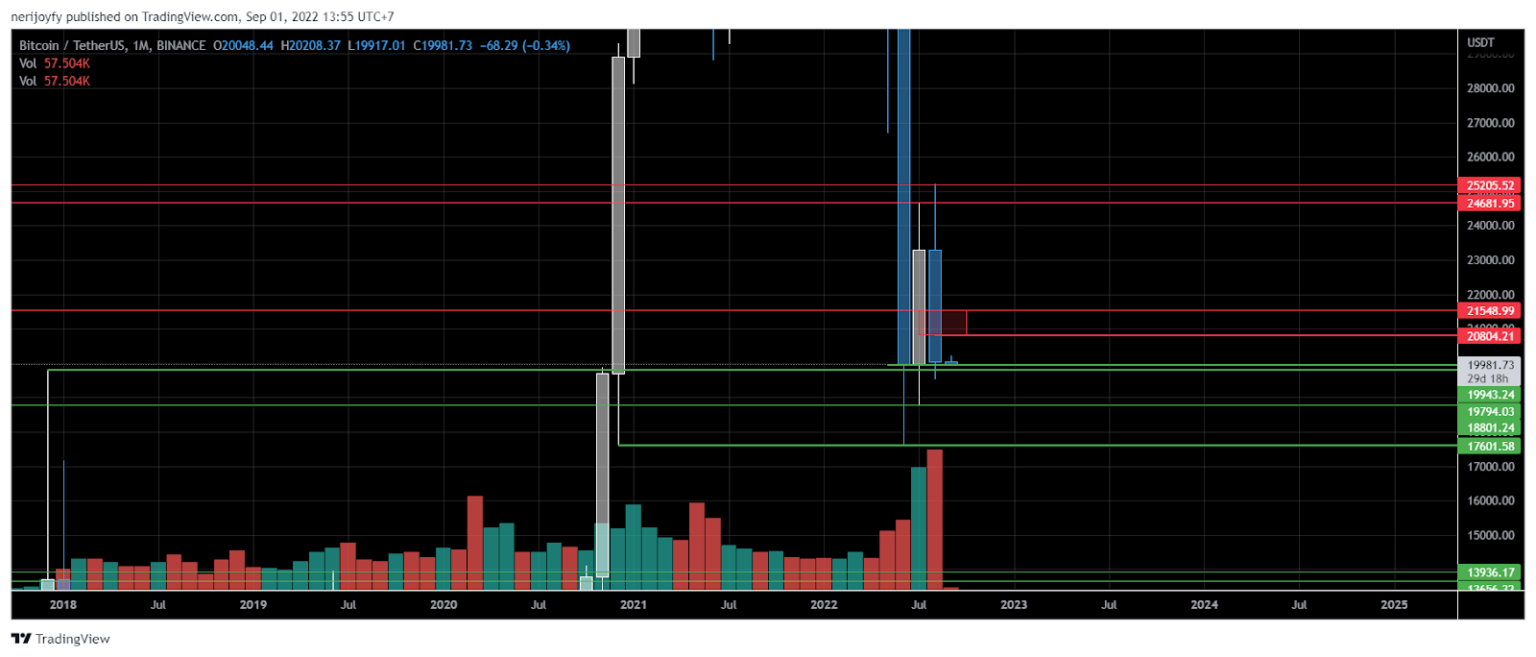
The August candle closed above the support level of $19,943. However, the September candle is currently testing this support. If this support is broken, the next support levels to watch are $19,794 and $18,800.
Resistance on the 1M chart is at the $24,681 – $25,205 range.
Weekly Chart (1W)
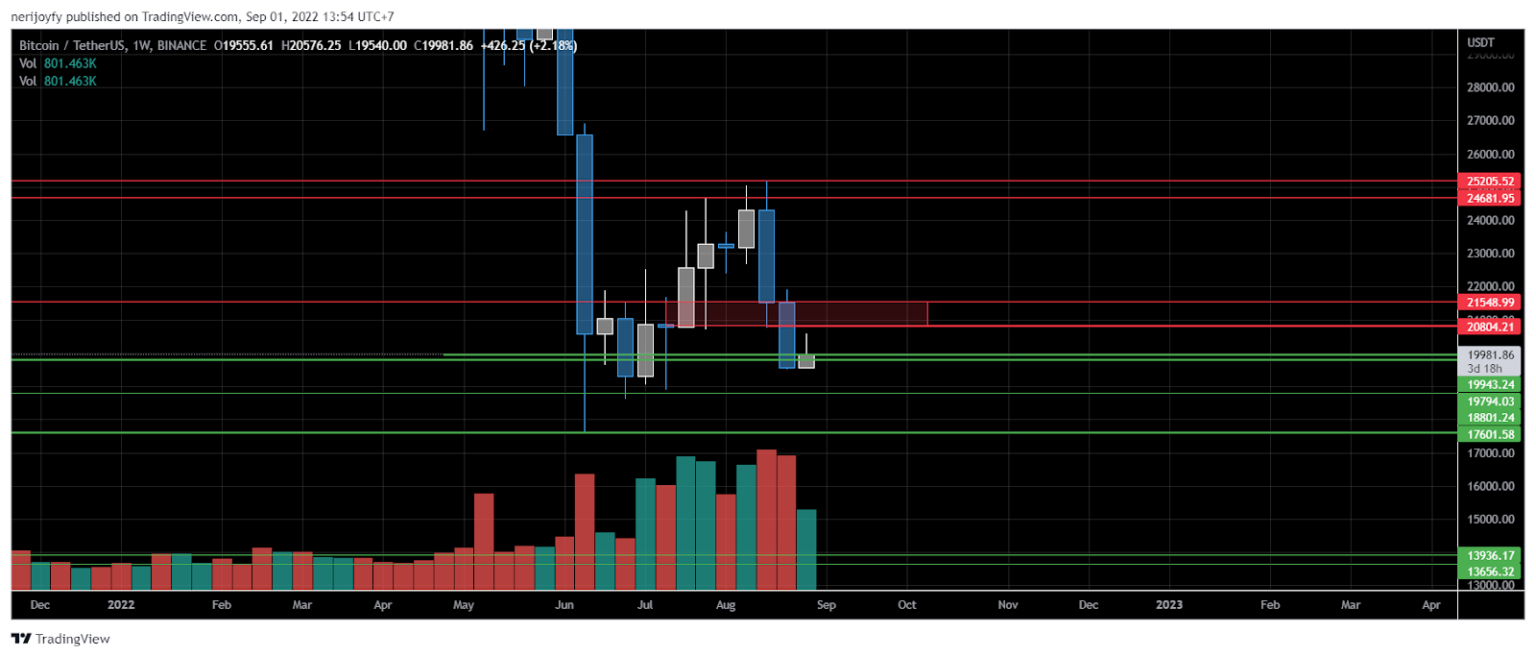
The weekly candle is hovering around the $20,000 mark and has a poor shape with a long wick, indicating that any attempts at price increases have failed. This candle could potentially form a bearish pin bar, a strong bearish signal in Price Action.
If the current weekly candle (August 29 – September 4) closes above the $19,943 support level, we might see buyers attempting to push the price higher. The key resistance levels on the 1W chart are $20,800 – $21,548.
Conversely, if the weekly candle closes below $19,943 or even worse, $19,794, a bearish pin bar will be formed, signaling a very negative outlook for buyers. The next support level to watch would be $18,800.
Patience is key; wait for the weekly candle to close before making any trading decisions.
Daily Chart (1D)
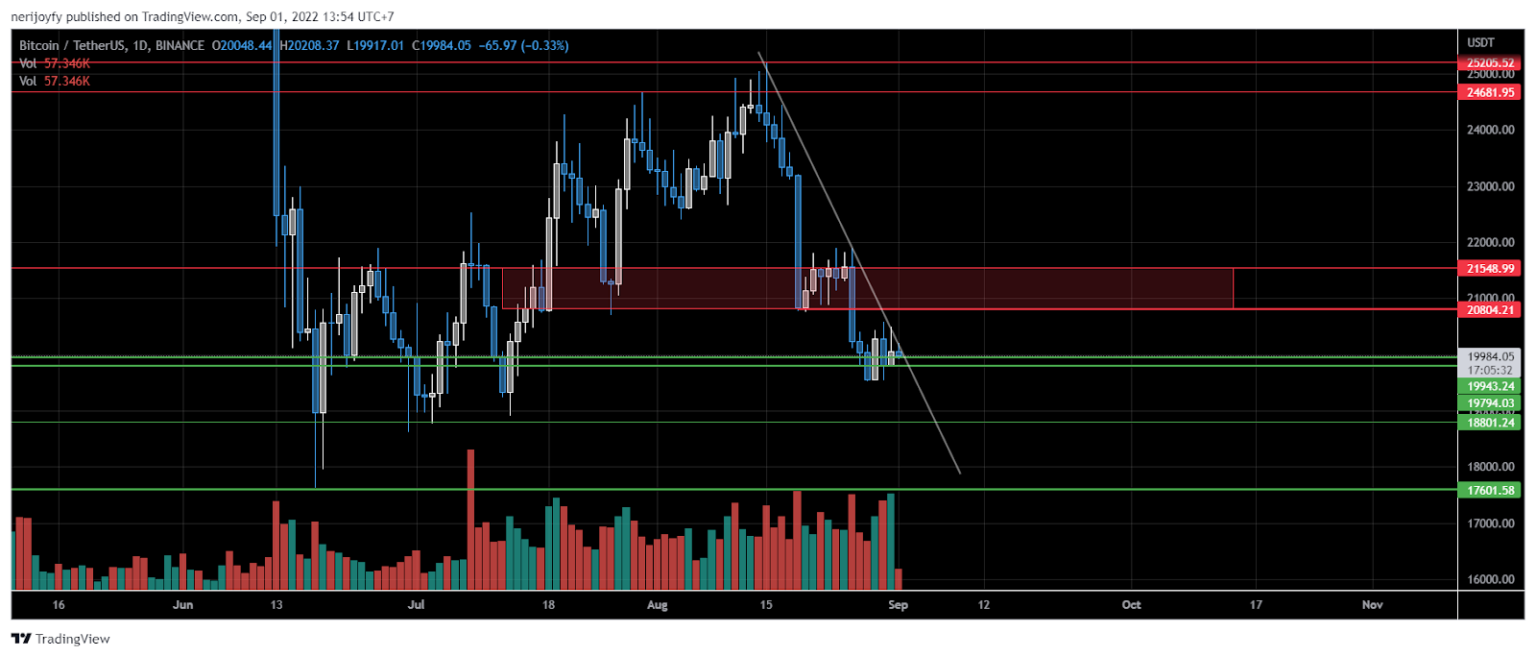
Price is currently at the confluence of the $19,943 support and a descending trendline. A breakout to the upside to reach resistance at $20,800 – $21,548 is what I’m expecting. However, there is a possibility of sideways movement due to typically low trading volumes over the weekend.
Summary
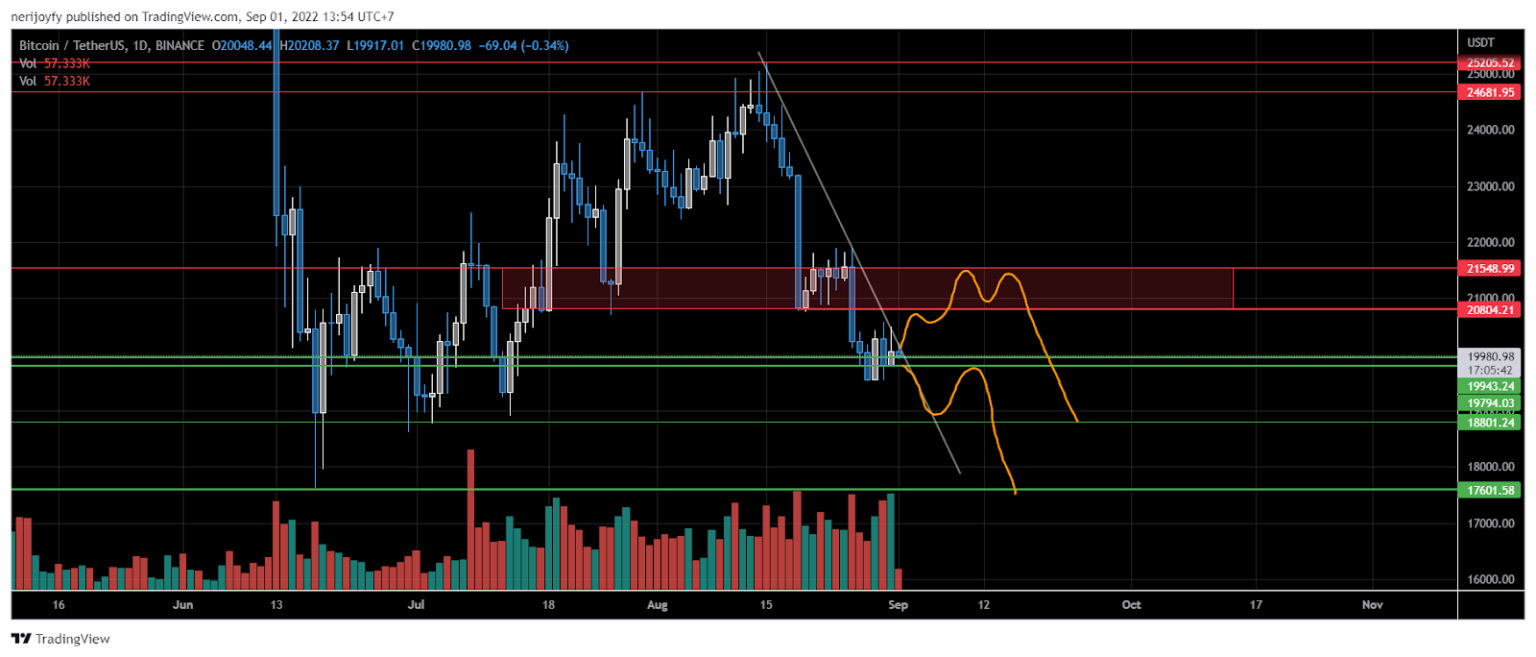
The overall trend remains bearish. Any attempts at price increases are likely to be considered retracement waves. Therefore, at this moment, looking for short setups seems more reasonable.
I will be looking for short setups around the $20,800 – $21,548 resistance zone or if the price breaks down below the $19,943 – $19,794 support zone, as illustrated below.