3 Reasons Bitcoin Won't Be 'Boring' in September
Even though Bitcoin failed to close above $60,000 last week, long-term holders (LTH) continue to adopt a bullish strategy heading into 2024. BTC Price Closes Below the 200-Day Moving Average Bitcoin's price has closed below the 200-day exponential moving average (EMA) for two consecutive weeks, but in the past 24 hours it has recovered above $60,000. Several charts suggest that long-term investors remain unfazed by current price action. Is a bullish breakout possible after August?

Even though Bitcoin failed to close above $60,000 last week, long-term holders (LTH) continue to adopt a bullish strategy heading into 2024.
BTC Price Closes Below the 200-Day Moving Average
Bitcoin's price has closed below the 200-day exponential moving average (EMA) for two consecutive weeks, but in the past 24 hours it has recovered above $60,000. Several charts suggest that long-term investors remain unfazed by current price action. Is a bullish breakout possible after August?
Long-Term Holder Realized Cap Hits $3 Billion
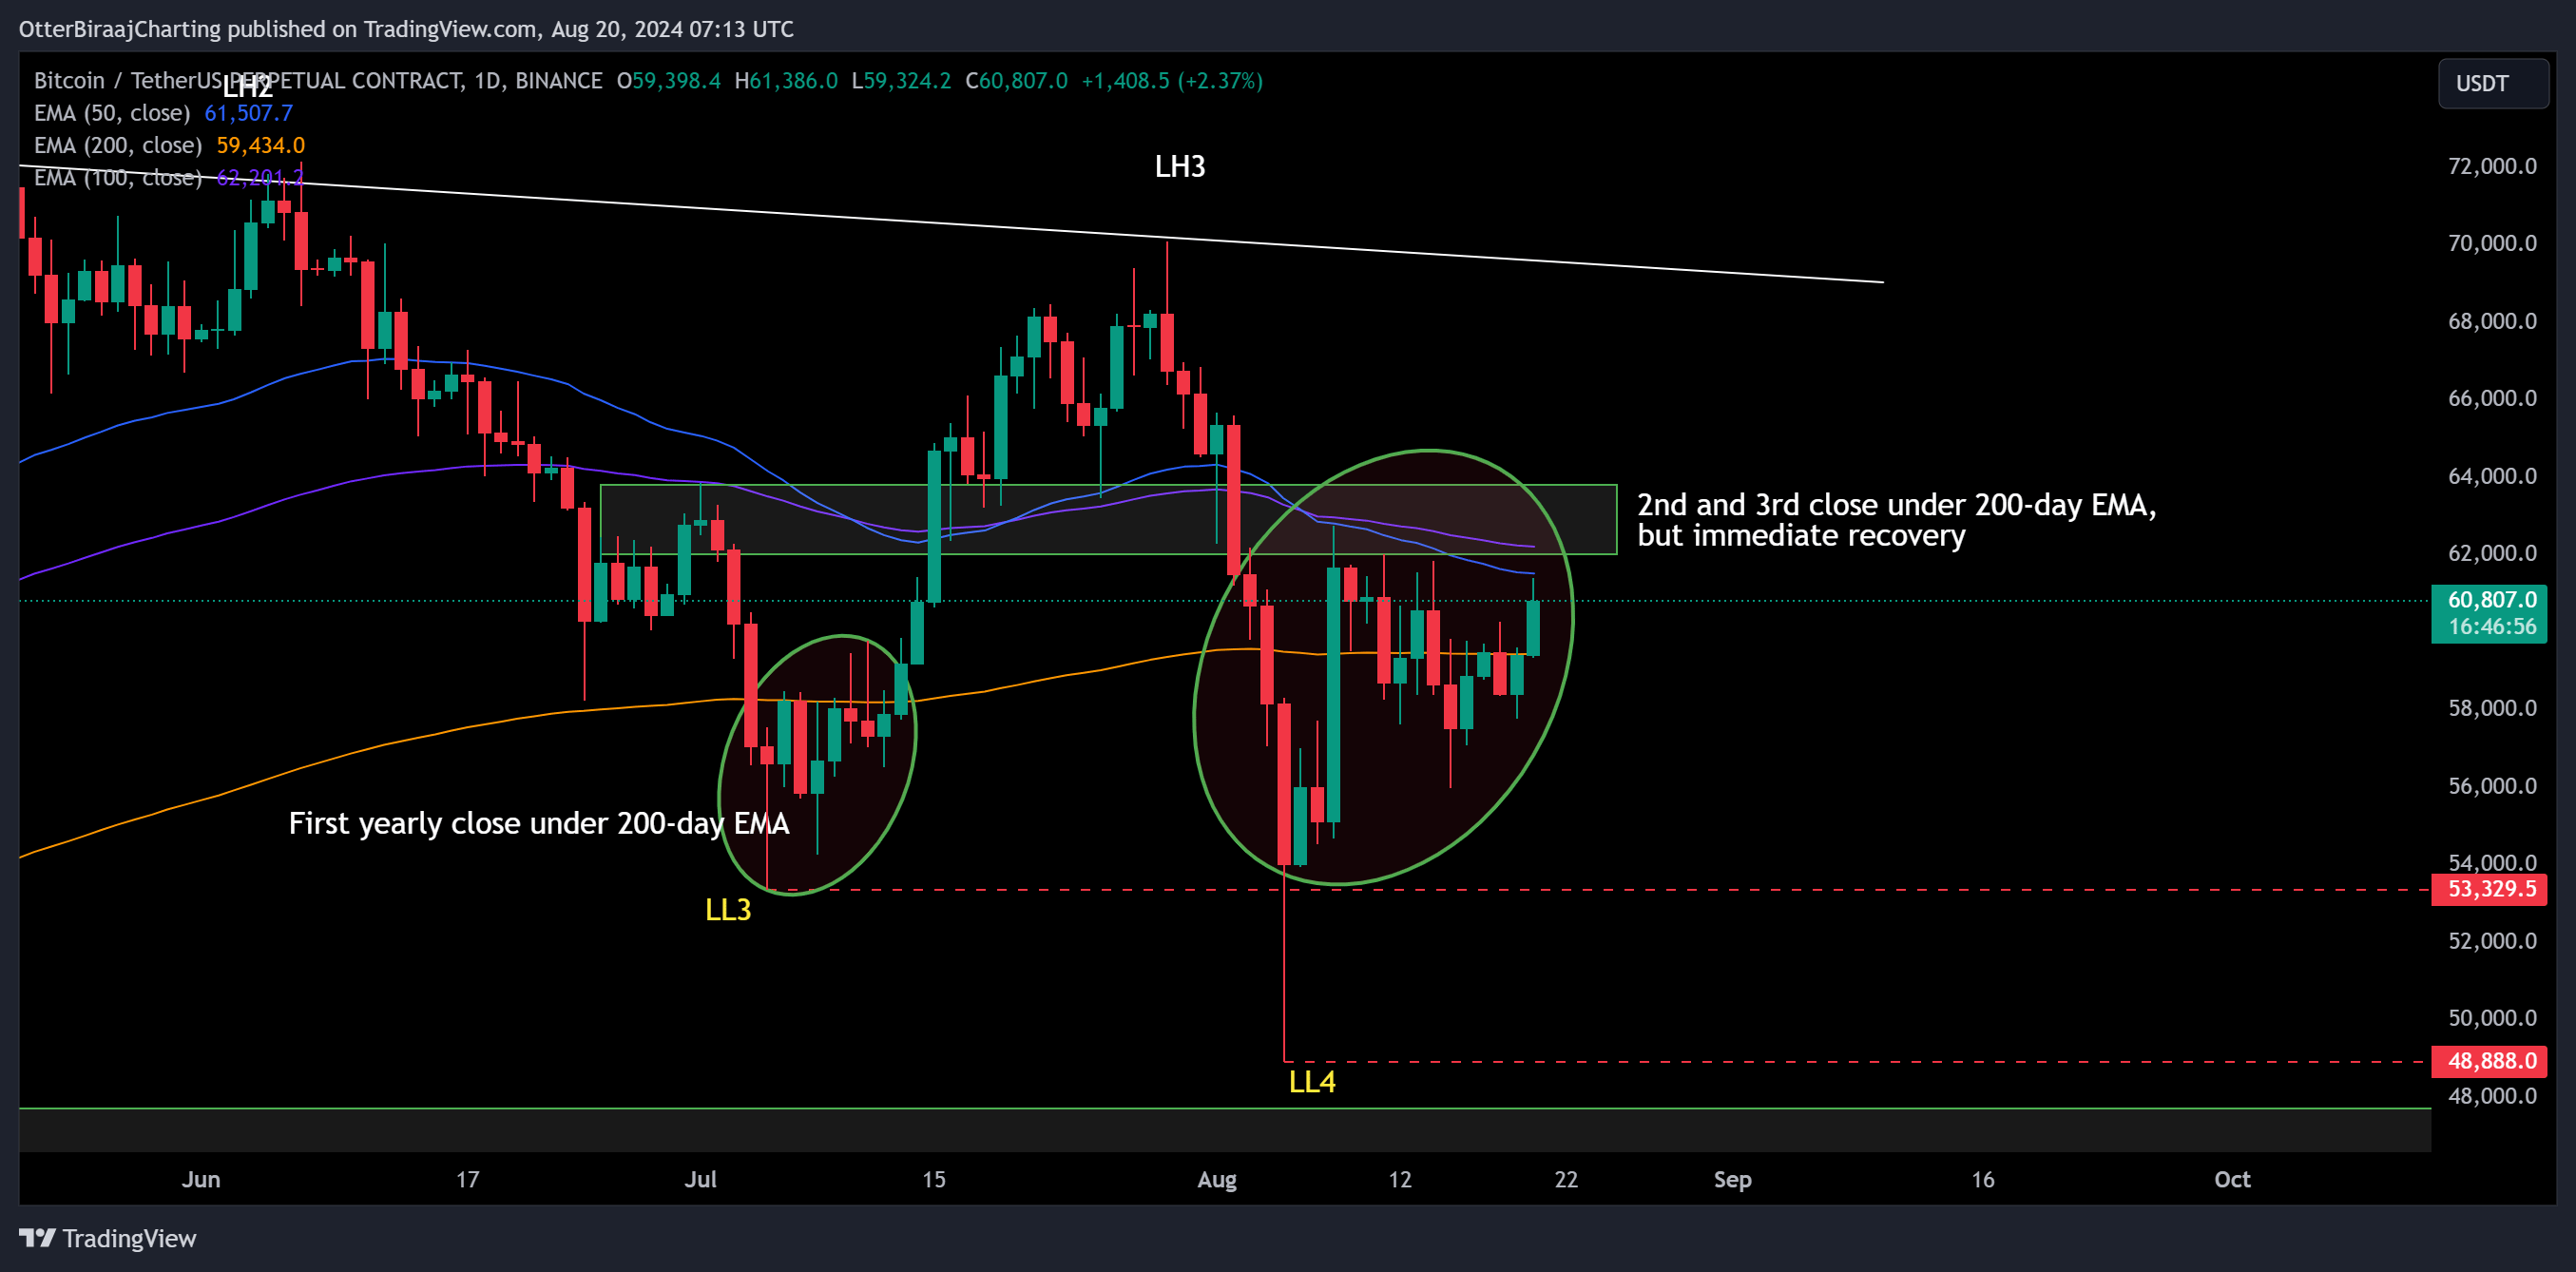
Bitcoin's price has only closed below the 200-day EMA three times in 2024. As the chart below shows, July 4 marked the first bearish close beneath the 200-day EMA.
The BTC/USD pair reclaimed its position above the EMA in fewer than 10 days. This time, the asset took less than 24 hours to climb back above the indicator, confirming that bullish momentum is gradually building this week.
Bitcoin investors can be divided into short-term holders (STH) and long-term holders (LTH), each with different trading strategies and time preferences.
STHs are investors or traders engaged in day trading or scalping, focused on quick profits over shorter time frames. Many of them are individuals or institutions with low to mid-range net worth.
LTHs, by contrast, are traders who employ a buy-and-hold strategy for at least six months. Many are high-net-worth individuals or large institutions — especially in the era of Bitcoin ETFs.
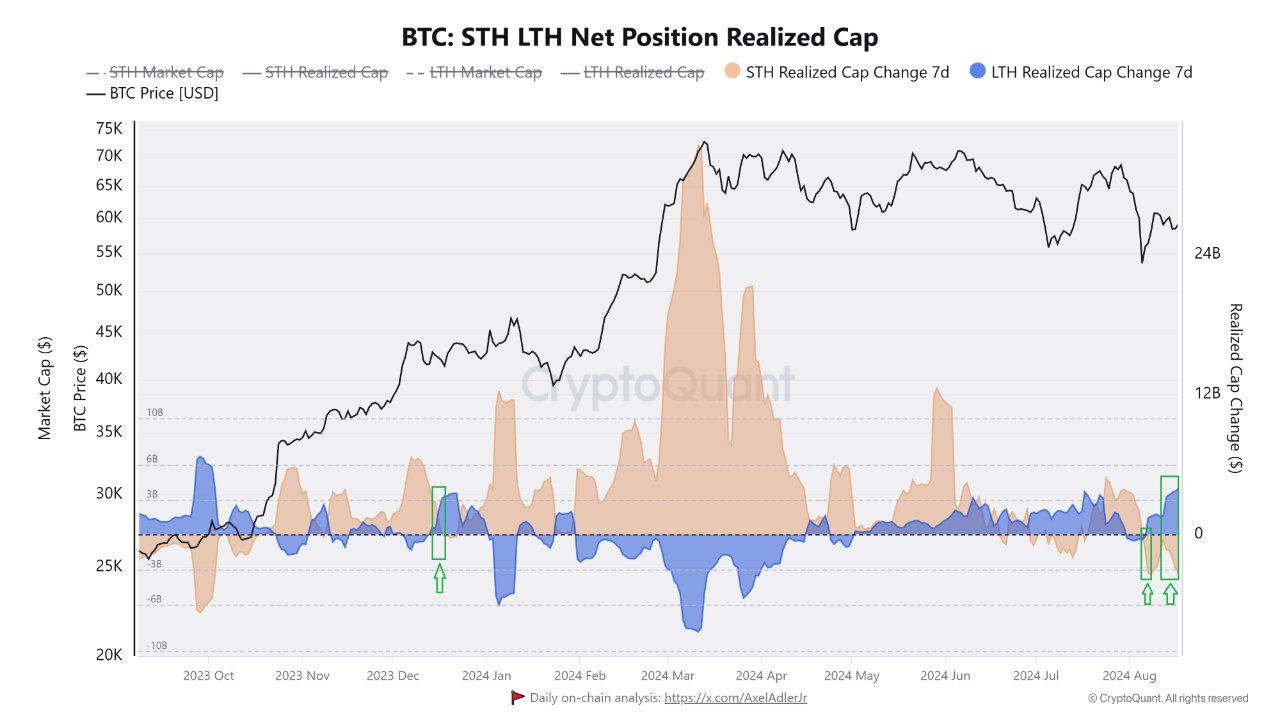
Recent data shows that the LTH realized market cap recorded a positive net value of $3 billion, a figure last seen in December 2023.
Bitcoin's realized cap is the sum of all realized profits minus all realized losses — in other words, the aggregate value that has flowed into Bitcoin on-chain, net of capital that exited through losses.
Bitcoin Miner Selling Pressure Is Stabilizing
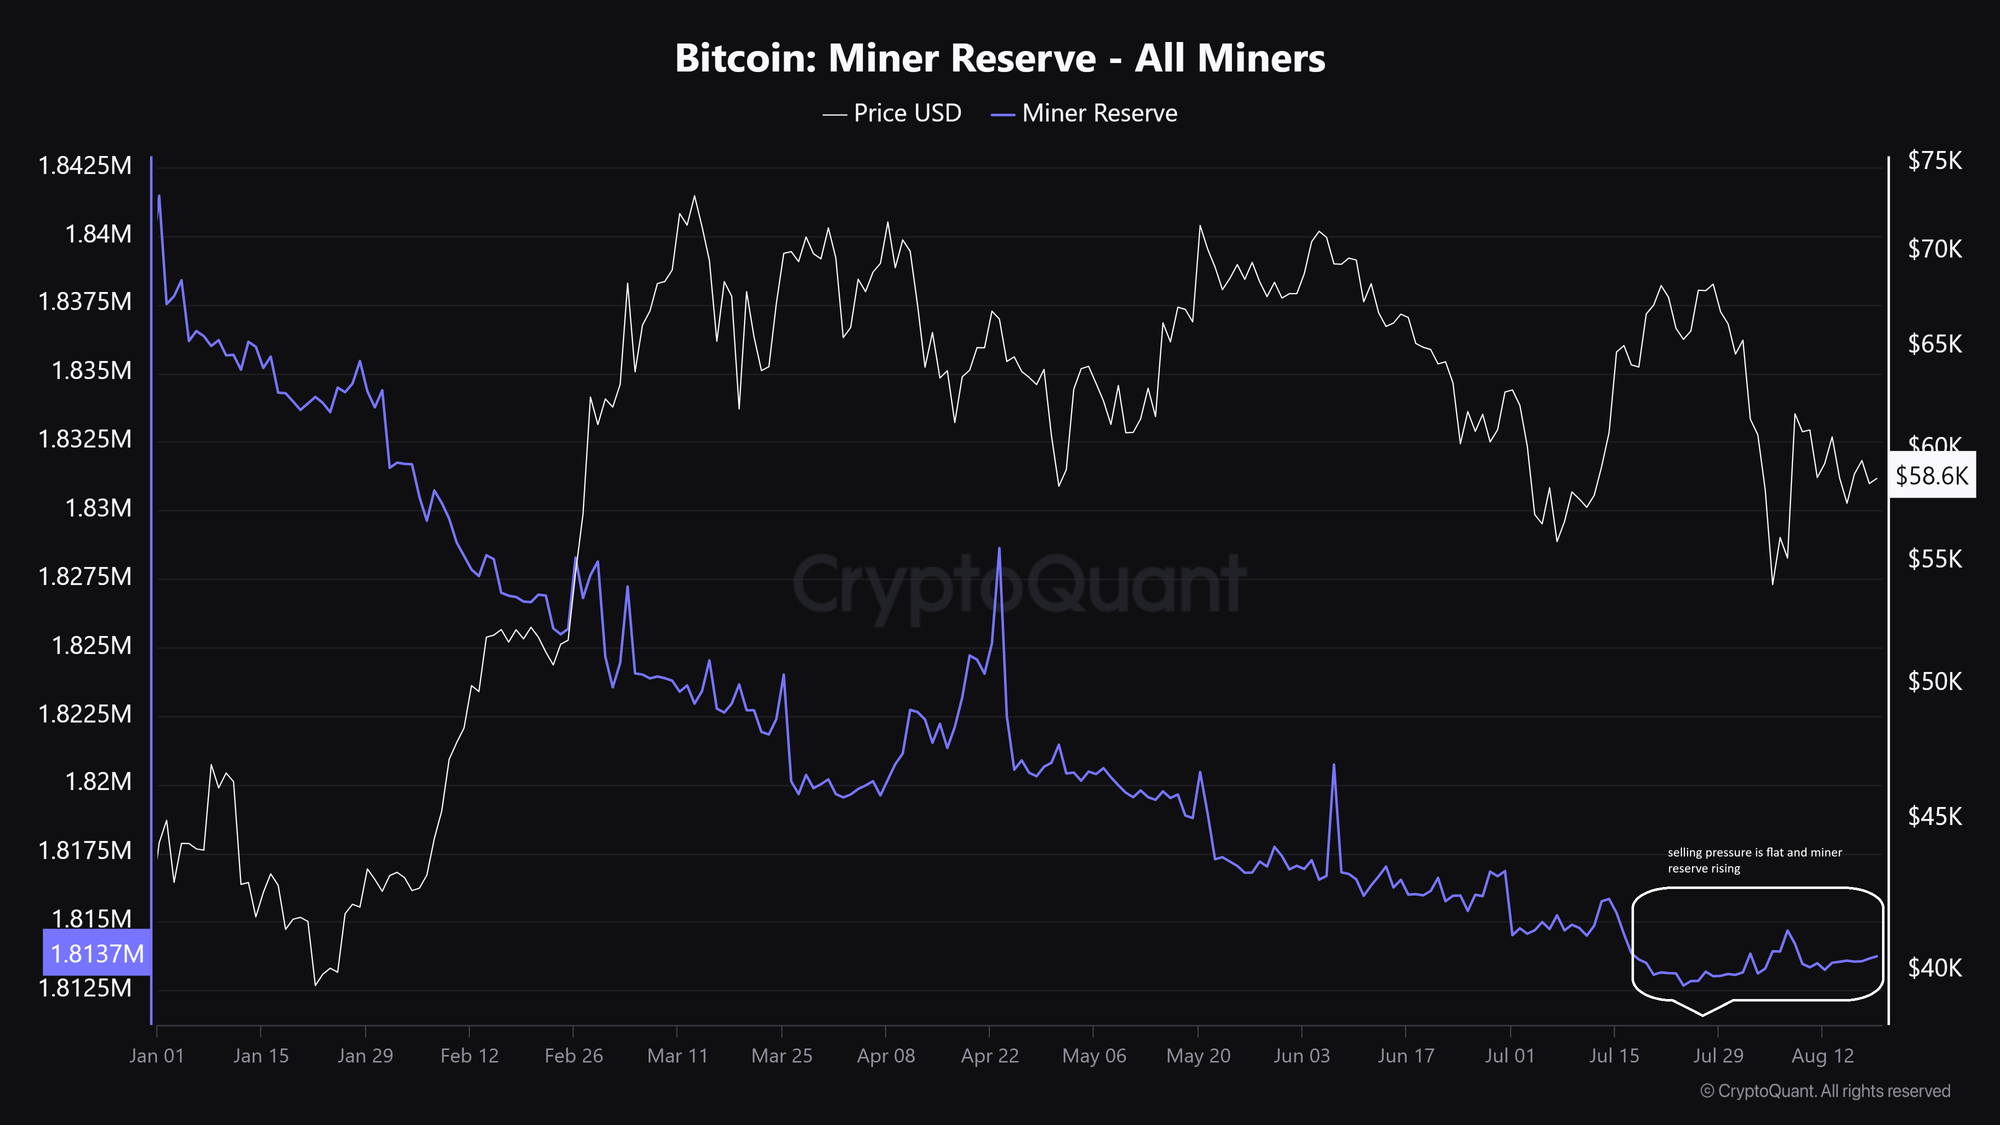
Bitcoin miners were selling BTC through exchanges as their net flows declined in Q2 2024. However, selling pressure has stabilized over the past two weeks as miner reserves have begun showing signs of a trend reversal toward accumulation.
The chart shows miner selling pressure dropping significantly in August, suggesting that BTC could consolidate at current price levels heading into next month.
Stablecoin Supply Ratio Trending Bullish
One of the key forces driving Bitcoin is the rise in global liquidity — specifically the global M2 money supply — which is beginning to climb.
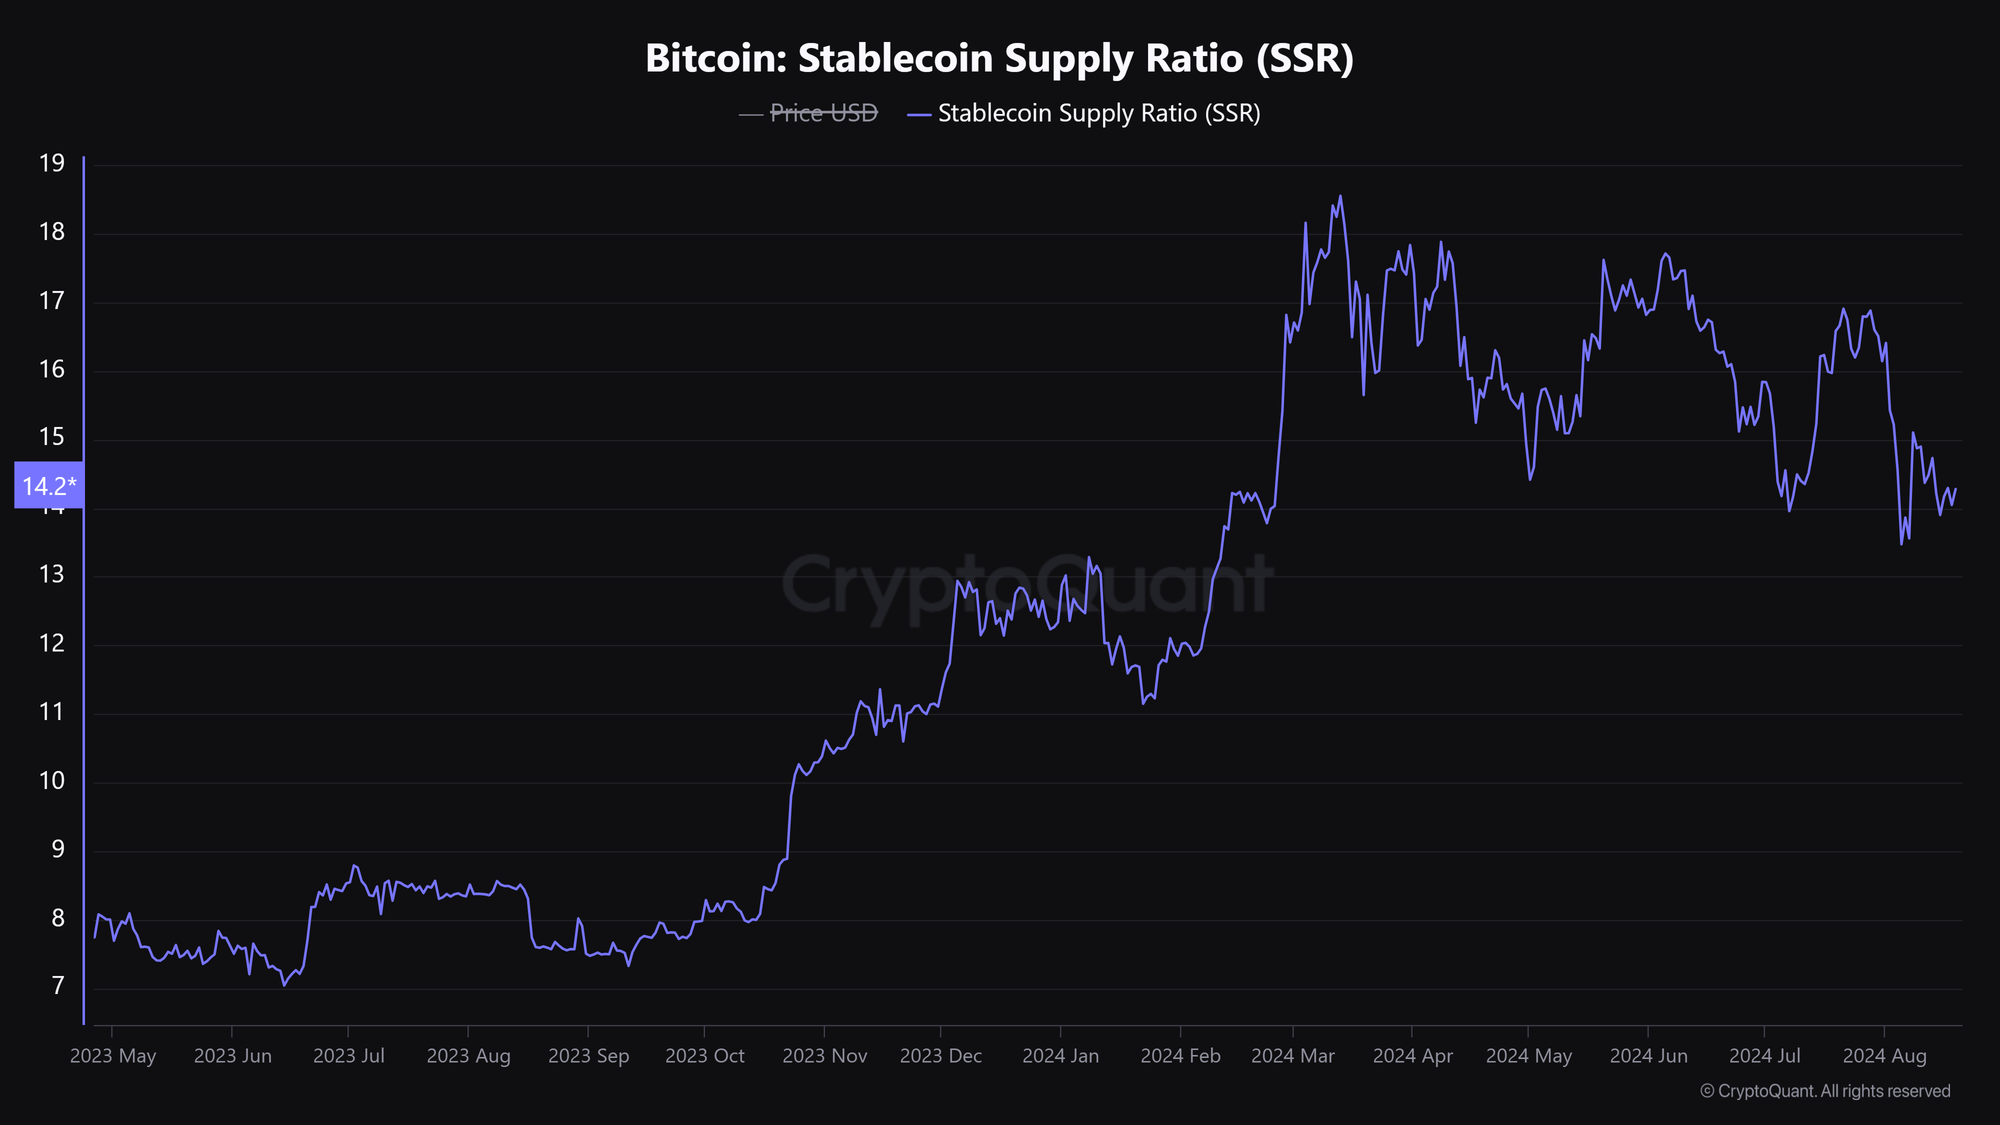
Similar to global liquidity, the Stablecoin Supply Ratio (SSR) reflects the amount of liquidity available in the form of stablecoins that could be deployed to buy Bitcoin.
The SSR is the ratio of total crypto market cap to the combined market cap of all stablecoins. A declining ratio indicates that stablecoin supply is growing while overall market cap is lagging, meaning more liquidity is available to purchase assets.
Currently, the SSR has dropped to levels last seen in early February 2024, signaling that more liquidity is available in the market — potentially triggering a price rally soon.
Julio Moreno, Head of Research at CryptoQuant, noted that stablecoin market cap has reached a new all-time high of $165 billion. He added, "This indicates higher liquidity in crypto markets."
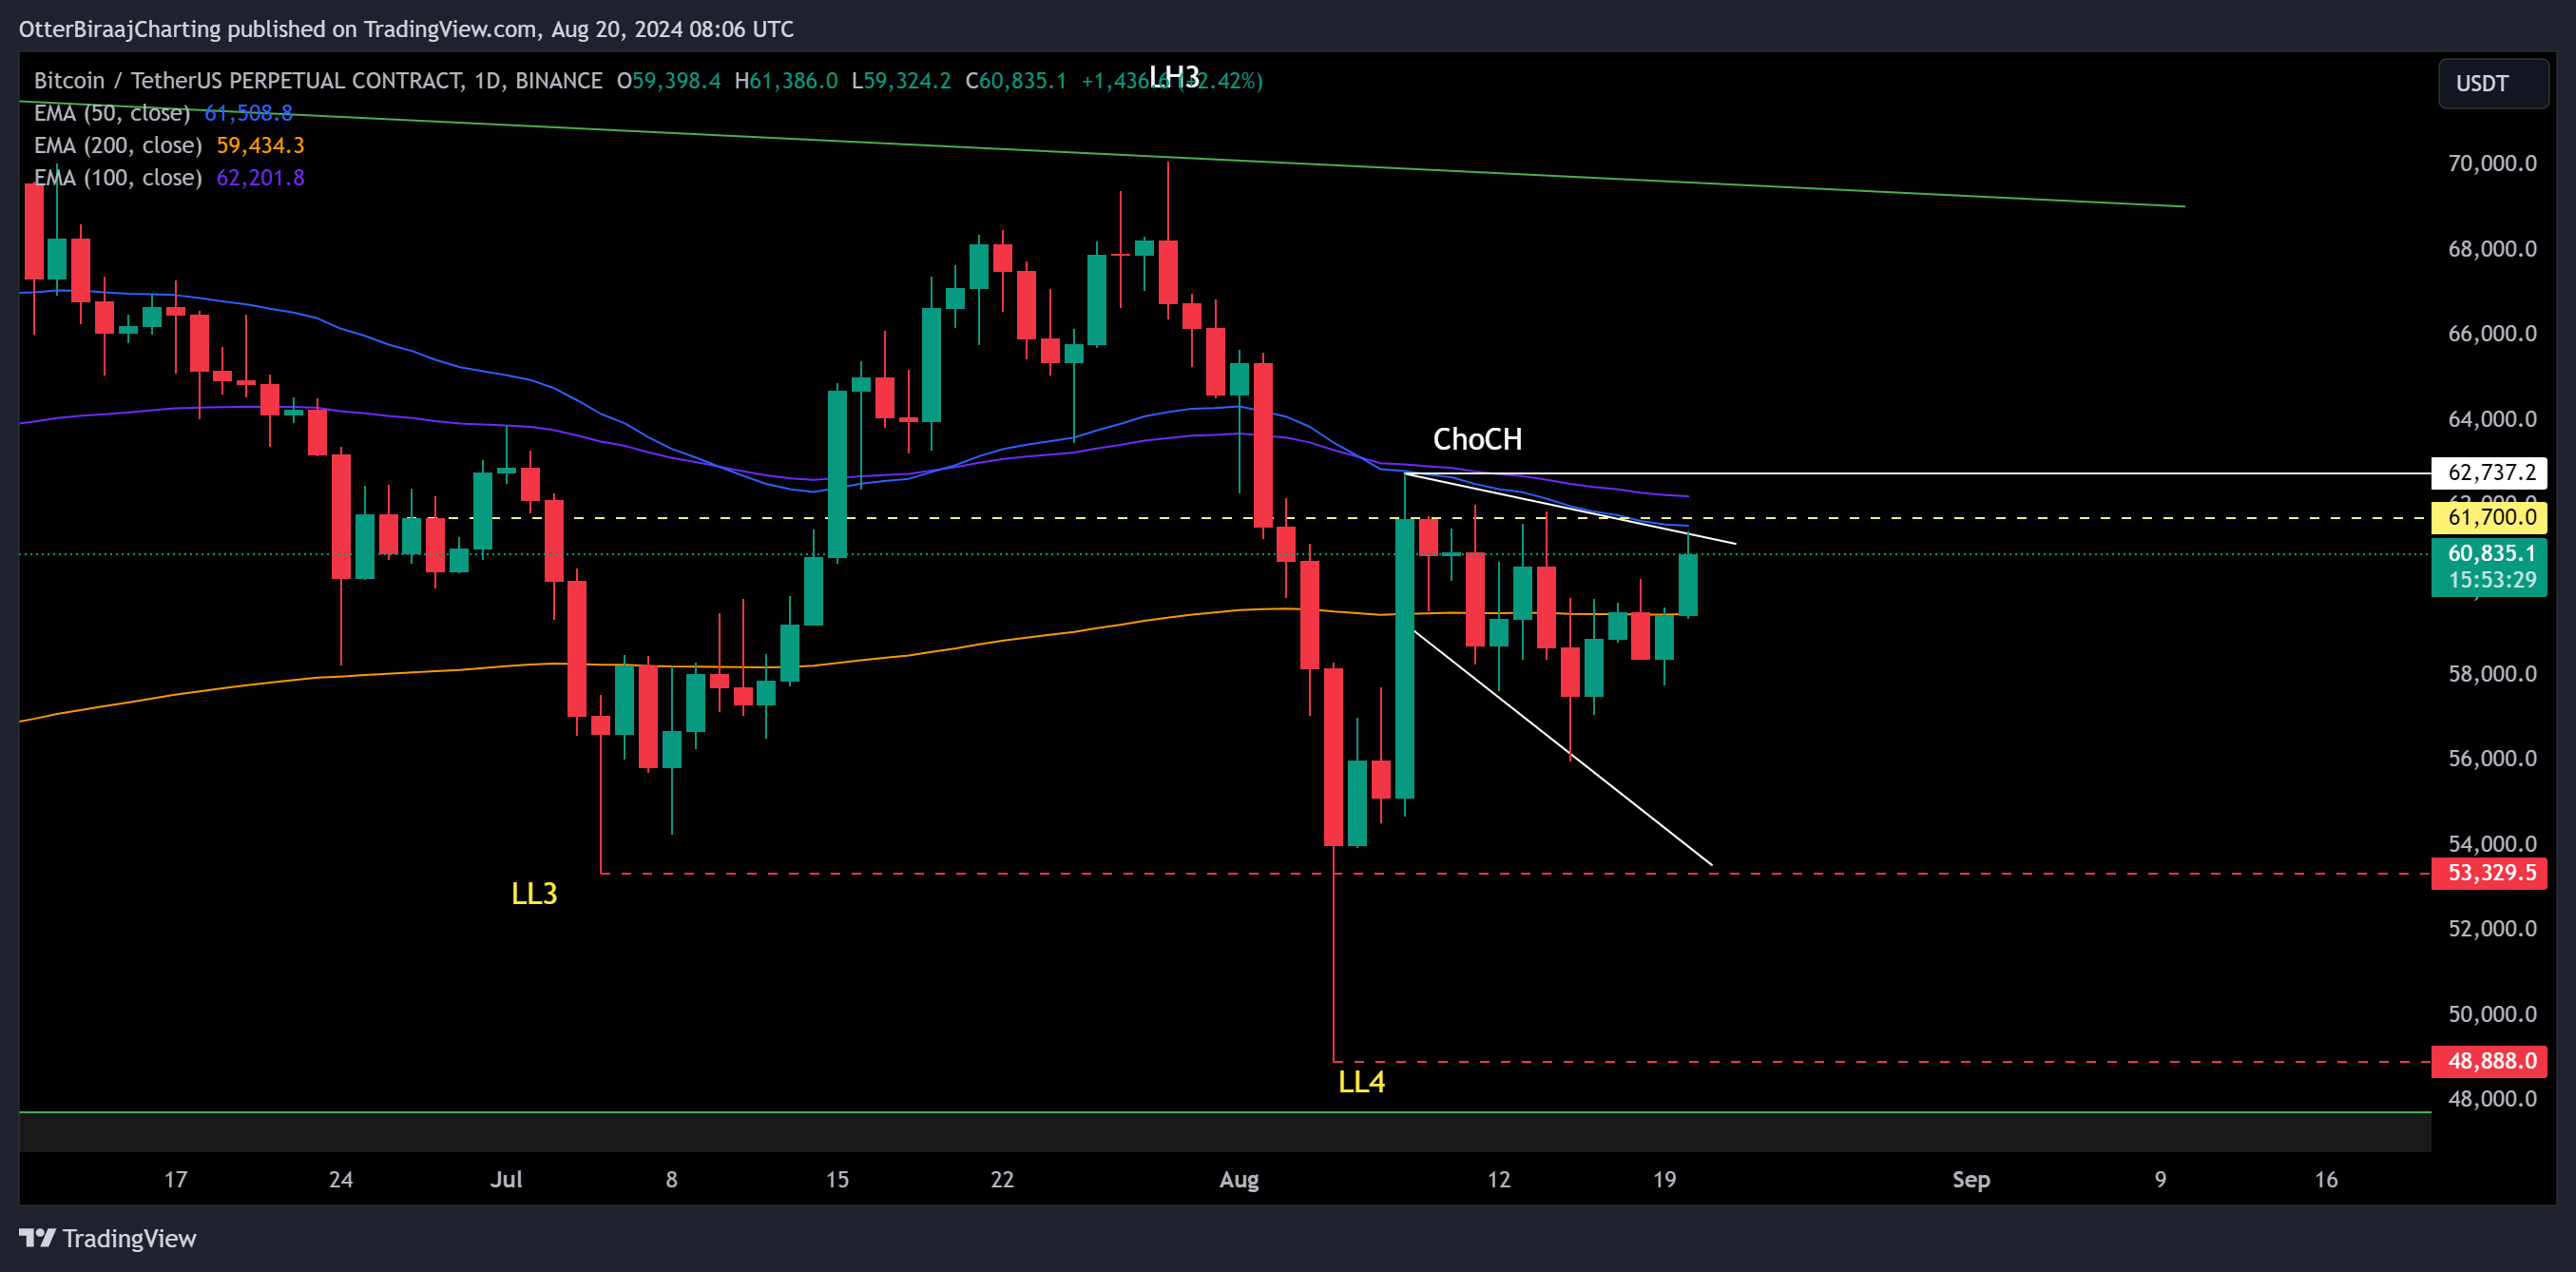
BTC Price Approaches "ChoCH" Level Above $62,000
After a disappointing weekly close, Bitcoin has staged a bullish recovery, gaining 4.50% over the past two days. BTC is attempting to break out of a descending broadening wedge pattern, which could carry significant bullish implications.
However, Bitcoin faces strong resistance just above the pattern at $61,700. The confluence of the 50-day EMA and the 100-day EMA also sits right around that level, suggesting it could continue to reject a bullish breakout.
If Bitcoin manages to break through the combined resistance from the EMAs and the $61,700 level, a bullish reversal would be confirmed once BTC clears $62,737. In September, this could trigger a market signal known as a "ChoCH" — or "Change of Character" — a hallmark sign of a trend reversal.